https://www.bankchb.com/csr/mashup_eng.jsp?funcId=3f64f1b215
PGh0bWw+IDxoZWFkPjxcL2hlYWQ+IDxib2R5PiAgPGdhcmRlbj4gICA8ZnVuY3M+ICAgICA8ZnVuYyBsYXlvdXQ9XCJzdWJhcmVhX2Z1bGxcIiBpc19vcGVuPVwiWVwiIHVsY2xhc3M9XCJcIiBuYW1lPVwiXHU5OTk2XHU5ODAxXCIgZGVzY3JpcHRpb249XCJcdTk5OTZcdTk4MDFcIiBpZD1cImluZGV4XCIgcGFnZT1cImluZGV4XCIgbGljbGFzcz1cIlwiIGljb25jbGFzcz1cIlwiIHVybD1cIlwiPiAgICAgPGZ1bmMgbGF5b3V0PVwic3ViYXJlYVwiIGlzX29wZW49XCJZXCIgdWxjbGFzcz1cIlwiIG5hbWU9XCJcdTg0NjNcdTRFOEJcdTk1NzdcdTc2ODRcdThBNzFcIiBkZXNjcmlwdGlvbj1cIlwiIGlkPVwiMDkyY2MyYzAxNVwiIHBhZ2U9XCIwOTJjYzJjMDE1XCIgbGljbGFzcz1cIlwiIGljb25jbGFzcz1cIlwiIHVybD1cIlwiPjxcL2Z1bmM+ICAgICA8ZnVuYyBsYXlvdXQ9XCJcIiBpc19vcGVuPVwiWVwiIHVsY2xhc3M9XCJcIiBuYW1lPVwiXHU2QzM4XHU3RThDXHU3NjdDXHU1QzU1XHU5MDRCXHU0RjVDXHU2QTVGXHU1MjM2XCIgZGVzY3JpcHRpb249XCJcdTZDMzhcdTdFOENcdTc2N0NcdTVDNTVcdTkwNEJcdTRGNUNcdTZBNUZcdTUyMzZcIiBpZD1cIjIzNThiNTMyMTVcIiBwYWdlPVwiXCIgbGljbGFzcz1cIlwiIGljb25jbGFzcz1cIlwiIHVybD1cIlwiPiAgICAgIDxmdW5jIGxheW91dD1cInN1YmNvbnRlbnRcIiBpc19vcGVuPVwiWVwiIHVsY2xhc3M9XCJcIiBuYW1lPVwiXHU2QzM4XHU3RThDXHU3NjdDXHU1QzU1XHU3RDQ0XHU3RTU0XHU2N0I2XHU2OUNCXHU1M0NBXHU5MDRCXHU0RjVDXHU2QTVGXHU1MjM2XCIgZGVzY3JpcHRpb249XCJcdTZDMzhcdTdFOENcdTc2N0NcdTVDNTVcdTdENDRcdTdFNTRcdTY3QjZcdTY5Q0JcIiBpZD1cIjBiZjEwM2QwMTVcIiBwYWdlPVwiMGJmMTAzZDAxNVwiIGxpY2xhc3M9XCJcIiBpY29uY2xhc3M9XCJcIiB1cmw9XCJcIj48XC9mdW5jPiAgICAgIDxmdW5jIGxheW91dD1cInN1YmNvbnRlbnRcIiBpc19vcGVuPVwiWVwiIHVsY2xhc3M9XCJcIiBuYW1lPVwiXHU1MjI5XHU1QkIzXHU5NURDXHU0RkMyXHU0RUJBXHU1QzA4XHU1MzQwXCIgZGVzY3JpcHRpb249XCJcIiBpZD1cIjVlNGI3MjA5MTVcIiBwYWdlPVwiNWU0YjcyMDkxNVwiIGxpY2xhc3M9XCJcIiBpY29uY2xhc3M9XCJcIiB1cmw9XCJcIj48XC9mdW5jPiAgICAgIDxmdW5jIGxheW91dD1cInN1YmNvbnRlbnRcIiBpc19vcGVuPVwiWVwiIHVsY2xhc3M9XCJcIiBuYW1lPVwiXHU5MUNEXHU1OTI3XHU0RTNCXHU5ODRDXHU5NDUxXHU1MjI1XHU4MjA3XHU3QkExXHU3NDA2XCIgZGVzY3JpcHRpb249XCJcIiBpZD1cImY1NzljYjI4MTVcIiBwYWdlPVwiZjU3OWNiMjgxNVwiIGxpY2xhc3M9XCJcIiBpY29uY2xhc3M9XCJcIiB1cmw9XCJcIj48XC9mdW5jPiAgICAgIDxmdW5jIGxheW91dD1cInN1YmFyZWFcIiBpc19vcGVuPVwiWVwiIHVsY2xhc3M9XCJcIiBuYW1lPVwiXHU2QzM4XHU3RThDXC9cdTRGMDFcdTY5NkRcdTc5M0VcdTY3MDNcdThDQUNcdTRFRkJcdTU4MzFcdTU0NEFcdTY2RjhcIiBkZXNjcmlwdGlvbj1cIkNTUlx1NTgzMVx1NTQ0QVx1NjZGOFwiIGlkPVwiN2M1MDA5MTExNVwiIHBhZ2U9XCI3YzUwMDkxMTE1XCIgbGljbGFzcz1cIlwiIGljb25jbGFzcz1cIlwiIHVybD1cImh0dHBzOlwvXC93d3cuYmFua2NoYi5jb21cL2NzclwvbWFzaHVwLmpzcD9mdW5jSWQ9NjZjNGM1MTExNVwiPjxcL2Z1bmM+ICAgICAgPGZ1bmMgbGF5b3V0PVwiXCIgaXNfb3Blbj1cIllcIiB1bGNsYXNzPVwiXCIgbmFtZT1cIlx1NTIyOVx1NUJCM1x1OTVEQ1x1NEZDMlx1NEVCQVx1NTU0Rlx1NTM3N1wiIGRlc2NyaXB0aW9uPVwiXCIgaWQ9XCIwNTQxZWE1NjE1XCIgcGFnZT1cIlwiIGxpY2xhc3M9XCJcIiBpY29uY2xhc3M9XCJcIiB1cmw9XCJodHRwczpcL1wvd3d3LmJhbmtjaGIuY29tXC9mcm9udGVuZFwvc3Rha2Vob2xkZXJRdWVzdGlvbi5qc3BcIj48XC9mdW5jPiAgICAgPFwvZnVuYz4gICAgIDxmdW5jIGxheW91dD1cIlwiIGlzX29wZW49XCJZXCIgdWxjbGFzcz1cIlwiIG5hbWU9XCJcdTZDMzhcdTdFOENcdTk3Q0NcdTYwMjdcIiBkZXNjcmlwdGlvbj1cIlwiIGlkPVwiYmJiN2JhNTIxNVwiIHBhZ2U9XCJcIiBsaWNsYXNzPVwiXCIgaWNvbmNsYXNzPVwiXCIgdXJsPVwiXCI+ICAgICAgPGZ1bmMgbGF5b3V0PVwiXCIgaXNfb3Blbj1cIllcIiB1bGNsYXNzPVwiXCIgbmFtZT1cIlx1NEYwMVx1Njk2RFx1Njk4Mlx1NkNDMVwiIGRlc2NyaXB0aW9uPVwiXCIgaWQ9XCI5ZTEyYWE1ZDE1XCIgcGFnZT1cIlwiIGxpY2xhc3M9XCJcIiBpY29uY2xhc3M9XCJcIiB1cmw9XCJcIj4gICAgICAgPGZ1bmMgbGF5b3V0PVwic3ViY29udGVudFwiIGlzX29wZW49XCJZXCIgdWxjbGFzcz1cIlwiIG5hbWU9XCJcdTRGMDFcdTY5NkRcdTY5ODJcdTZDQzFcdTgyMDdcdTcxREZcdTkwNEJcdTdFM0VcdTY1NDhcIiBkZXNjcmlwdGlvbj1cIlwiIGlkPVwiM2M3YmM4N2QxNVwiIHBhZ2U9XCIzYzdiYzg3ZDE1XCIgbGljbGFzcz1cIlwiIGljb25jbGFzcz1cIlwiIHVybD1cIlwiPjxcL2Z1bmM+ICAgICAgIDxmdW5jIGxheW91dD1cInN1YmNvbnRlbnRcIiBpc19vcGVuPVwiWVwiIHVsY2xhc3M9XCJcIiBuYW1lPVwiXHU3QTA1XHU1MkQ5XHU2Q0JCXHU3NDA2XCIgZGVzY3JpcHRpb249XCJcIiBpZD1cIjk4M2EwZjQ1MTVcIiBwYWdlPVwiOTgzYTBmNDUxNVwiIGxpY2xhc3M9XCJcIiBpY29uY2xhc3M9XCJcIiB1cmw9XCJcIj48XC9mdW5jPiAgICAgIDxcL2Z1bmM+ICAgICAgPGZ1bmMgbGF5b3V0PVwiXCIgaXNfb3Blbj1cIllcIiB1bGNsYXNzPVwiXCIgbmFtZT1cIlx1NTE2Q1x1NTNGOFx1NkNCQlx1NzQwNlwiIGRlc2NyaXB0aW9uPVwiXCIgaWQ9XCJlZWU5NDkzYjE1XCIgcGFnZT1cIlwiIGxpY2xhc3M9XCJcIiBpY29uY2xhc3M9XCJcIiB1cmw9XCJcIj4gICAgICAgPGZ1bmMgbGF5b3V0PVwic3ViY29udGVudFwiIGlzX29wZW49XCJZXCIgdWxjbGFzcz1cIlwiIG5hbWU9XCJcdTUxNkNcdTUzRjhcdTZDQkJcdTc0MDZcdTY3QjZcdTY5Q0JcdTgyMDdcdTg0NjNcdTRFOEJcdTY3MDNcdTkwNEJcdTRGNUNcIiBkZXNjcmlwdGlvbj1cIlwiIGlkPVwiMjM1NWQ1MGExNVwiIHBhZ2U9XCIyMzU1ZDUwYTE1XCIgbGljbGFzcz1cIlwiIGljb25jbGFzcz1cIlwiIHVybD1cIlwiPjxcL2Z1bmM+ICAgICAgIDxmdW5jIGxheW91dD1cInN1YmNvbnRlbnRcIiBpc19vcGVuPVwiWVwiIHVsY2xhc3M9XCJcIiBuYW1lPVwiXHU4NDYzXHU0RThCXHU2NzAzXHU3RTNFXHU2NTQ4XHU4MjA3XHU4NUFBXHU5MTZDXCIgZGVzY3JpcHRpb249XCJcIiBpZD1cImE1YzdlYmU3MTVcIiBwYWdlPVwiYTVjN2ViZTcxNVwiIGxpY2xhc3M9XCJcIiBpY29uY2xhc3M9XCJcIiB1cmw9XCJcIj48XC9mdW5jPiAgICAgIDxcL2Z1bmM+ICAgICAgPGZ1bmMgbGF5b3V0PVwic3ViY29udGVudFwiIGlzX29wZW49XCJZXCIgdWxjbGFzcz1cIlwiIG5hbWU9XCJcdThBQTBcdTRGRTFcdTdEOTNcdTcxREZcIiBkZXNjcmlwdGlvbj1cIlwiIGlkPVwiMjAzYmQ1ZWIxNVwiIHBhZ2U9XCIyMDNiZDVlYjE1XCIgbGljbGFzcz1cIlwiIGljb25jbGFzcz1cIlwiIHVybD1cIlwiPjxcL2Z1bmM+ICAgICAgPGZ1bmMgbGF5b3V0PVwic3ViY29udGVudFwiIGlzX29wZW49XCJZXCIgdWxjbGFzcz1cIlwiIG5hbWU9XCJcdTZDRDVcdTRFRTRcdTkwNzVcdTVGQUFcIiBkZXNjcmlwdGlvbj1cIlwiIGlkPVwiZWY5MDEwMTQxNlwiIHBhZ2U9XCJlZjkwMTAxNDE2XCIgbGljbGFzcz1cIlwiIGljb25jbGFzcz1cIlwiIHVybD1cIlwiPjxcL2Z1bmM+ICAgICAgPGZ1bmMgbGF5b3V0PVwic3ViY29udGVudFwiIGlzX29wZW49XCJZXCIgdWxjbGFzcz1cIlwiIG5hbWU9XCJcdTZEMTdcdTkzMjJcdTk2MzJcdTUyMzZcdTgyMDdcdTYyNTNcdTY0Q0FcdThDQzdcdTYwNTBcIiBkZXNjcmlwdGlvbj1cIlwiIGlkPVwiYTNiYWIzZTMxNlwiIHBhZ2U9XCJhM2JhYjNlMzE2XCIgbGljbGFzcz1cIlwiIGljb25jbGFzcz1cIlwiIHVybD1cIlwiPjxcL2Z1bmM+ICAgICAgPGZ1bmMgbGF5b3V0PVwic3ViY29udGVudFwiIGlzX29wZW49XCJZXCIgdWxjbGFzcz1cIlwiIG5hbWU9XCJcdTk4QThcdTk2QUFcdTdCQTFcdTc0MDZcdTgyMDdcdTdBM0RcdTY4MzhcdTUyMzZcdTVFQTZcIiBkZXNjcmlwdGlvbj1cIlwiIGlkPVwiYzBjNDU2MGExNVwiIHBhZ2U9XCJjMGM0NTYwYTE1XCIgbGljbGFzcz1cIlwiIGljb25jbGFzcz1cIlwiIHVybD1cIlwiPiAgICAgICA8ZnVuYyBsYXlvdXQ9XCJzdWJjb250ZW50XCIgaXNfb3Blbj1cIllcIiB1bGNsYXNzPVwiXCIgbmFtZT1cIlx1OThBOFx1OTZBQVx1N0JBMVx1NzQwNlx1ODIwN1x1N0EzRFx1NjgzOFx1NTIzNlx1NUVBNlwiIGRlc2NyaXB0aW9uPVwiXCIgaWQ9XCJlYjMwNzExNTE2XCIgcGFnZT1cImViMzA3MTE1MTZcIiBsaWNsYXNzPVwiXCIgaWNvbmNsYXNzPVwiXCIgdXJsPVwiXCI+PFwvZnVuYz4gICAgICAgPGZ1bmMgbGF5b3V0PVwic3ViY29udGVudFwiIGlzX29wZW49XCJZXCIgdWxjbGFzcz1cIlwiIG5hbWU9XCJcdTY1QjBcdTgyMDhcdTk4QThcdTk2QUFcdTdCQTFcdTc0MDZcIiBkZXNjcmlwdGlvbj1cIlwiIGlkPVwiYWE0ZDNiNDMxNlwiIHBhZ2U9XCJhYTRkM2I0MzE2XCIgbGljbGFzcz1cIlwiIGljb25jbGFzcz1cIlwiIHVybD1cIlwiPjxcL2Z1bmM+ICAgICAgIDxmdW5jIGxheW91dD1cInN1YmNvbnRlbnRcIiBpc19vcGVuPVwiWVwiIHVsY2xhc3M9XCJcIiBuYW1lPVwiXHU2NjdBXHU2MTY3XHU4Q0ExXHU3NTIyXHU2QjBBXHU3QkExXHU3NDA2XCIgZGVzY3JpcHRpb249XCJcIiBpZD1cIjRmODQ1OGIzMTZcIiBwYWdlPVwiNGY4NDU4YjMxNlwiIGxpY2xhc3M9XCJcIiBpY29uY2xhc3M9XCJcIiB1cmw9XCJcIj48XC9mdW5jPiAgICAgIDxcL2Z1bmM+ICAgICAgPGZ1bmMgbGF5b3V0PVwiXCIgaXNfb3Blbj1cIllcIiB1bGNsYXNzPVwiXCIgbmFtZT1cIlx1OENDN1x1OEEwQVx1NUI4OVx1NTE2OFx1MzAwMVx1NTAwQlx1OENDN1x1OTYzMlx1OEI3N1x1ODIwN1x1NzFERlx1Njk2RFx1NzlEOFx1NUJDNlx1NEZERFx1OEI3N1wiIGRlc2NyaXB0aW9uPVwiXCIgaWQ9XCI1ZmE3MmFjZTE1XCIgcGFnZT1cIlwiIGxpY2xhc3M9XCJcIiBpY29uY2xhc3M9XCJcIiB1cmw9XCJcIj4gICAgICAgPGZ1bmMgbGF5b3V0PVwic3ViY29udGVudFwiIGlzX29wZW49XCJZXCIgdWxjbGFzcz1cIlwiIG5hbWU9XCJcdThDQzdcdThBMEFcdTVCODlcdTUxNjhcdTZBNUZcdTUyMzZcIiBkZXNjcmlwdGlvbj1cIlwiIGlkPVwiNGRhMDEzZWExNVwiIHBhZ2U9XCI0ZGEwMTNlYTE1XCIgbGljbGFzcz1cIlwiIGljb25jbGFzcz1cIlwiIHVybD1cIlwiPjxcL2Z1bmM+ICAgICAgIDxmdW5jIGxheW91dD1cInN1YmNvbnRlbnRcIiBpc19vcGVuPVwiWVwiIHVsY2xhc3M9XCJcIiBuYW1lPVwiXHU1MDBCXHU0RUJBXHU4Q0M3XHU2NTk5XHU0RkREXHU4Qjc3XCIgZGVzY3JpcHRpb249XCJcIiBpZD1cIjMyNmQxNmM4MTVcIiBwYWdlPVwiMzI2ZDE2YzgxNVwiIGxpY2xhc3M9XCJcIiBpY29uY2xhc3M9XCJcIiB1cmw9XCJcIj48XC9mdW5jPiAgICAgICA8ZnVuYyBsYXlvdXQ9XCJzdWJjb250ZW50XCIgaXNfb3Blbj1cIllcIiB1bGNsYXNzPVwiXCIgbmFtZT1cIlx1NzFERlx1Njk2RFx1NzlEOFx1NUJDNlx1NEZERFx1OEI3N1wiIGRlc2NyaXB0aW9uPVwiXCIgaWQ9XCJhNTRkNDAwMTE1XCIgcGFnZT1cImE1NGQ0MDAxMTVcIiBsaWNsYXNzPVwiXCIgaWNvbmNsYXNzPVwiXCIgdXJsPVwiXCI+PFwvZnVuYz4gICAgICA8XC9mdW5jPiAgICAgPFwvZnVuYz4gICAgIDxmdW5jIGxheW91dD1cIlwiIGlzX29wZW49XCJZXCIgdWxjbGFzcz1cIlwiIG5hbWU9XCJcdTZDMzhcdTdFOENcdTkxRDFcdTg3OEQgXHU2QzM4XHU3RThDXHU3NEIwXHU1ODgzXCIgZGVzY3JpcHRpb249XCJcIiBpZD1cImY4NTA4MjM4MTVcIiBwYWdlPVwiXCIgbGljbGFzcz1cIlwiIGljb25jbGFzcz1cIlwiIHVybD1cIlwiPiAgICAgIDxmdW5jIGxheW91dD1cInN1YmNvbnRlbnRcIiBpc19vcGVuPVwiWVwiIHVsY2xhc3M9XCJcIiBuYW1lPVwiXHU1MTZDXHU1RTczXHU1Rjg1XHU1QkEyXHU4MjA3XHU5NjMyXHU4QTUwXHU1Qjg5XHU1MTY4XHU3REIyXCIgZGVzY3JpcHRpb249XCJcIiBpZD1cIjgwOTkzZDMzMTVcIiBwYWdlPVwiODA5OTNkMzMxNVwiIGxpY2xhc3M9XCJcIiBpY29uY2xhc3M9XCJcIiB1cmw9XCJcIj48XC9mdW5jPiAgICAgIDxmdW5jIGxheW91dD1cInN1YmNvbnRlbnRcIiBpc19vcGVuPVwiWVwiIHVsY2xhc3M9XCJcIiBuYW1lPVwiXHU2NTc4XHU0RjREXHU1Mjc1XHU2NUIwXHU2NzBEXHU1MkQ5XCIgZGVzY3JpcHRpb249XCJcIiBpZD1cIjQxZTFiZTFkMTVcIiBwYWdlPVwiNDFlMWJlMWQxNVwiIGxpY2xhc3M9XCJcIiBpY29uY2xhc3M9XCJcIiB1cmw9XCJcIj48XC9mdW5jPiAgICAgIDxmdW5jIGxheW91dD1cInN1YmNvbnRlbnRcIiBpc19vcGVuPVwiWVwiIHVsY2xhc3M9XCJcIiBuYW1lPVwiXHU2NjZFXHU2MEUwXHU5MUQxXHU4NzhEXCIgZGVzY3JpcHRpb249XCJcIiBpZD1cImFmZmUyMDQ0MTZcIiBwYWdlPVwiYWZmZTIwNDQxNlwiIGxpY2xhc3M9XCJcIiBpY29uY2xhc3M9XCJcIiB1cmw9XCJcIj48XC9mdW5jPiAgICAgIDxmdW5jIGxheW91dD1cInN1YmNvbnRlbnRcIiBpc19vcGVuPVwiWVwiIHVsY2xhc3M9XCJcIiBuYW1lPVwiXHU4Q0FDXHU0RUZCXHU5MUQxXHU4NzhEXCIgZGVzY3JpcHRpb249XCJcIiBpZD1cIjEyNzRhNjdmMTVcIiBwYWdlPVwiMTI3NGE2N2YxNVwiIGxpY2xhc3M9XCJcIiBpY29uY2xhc3M9XCJcIiB1cmw9XCJcIj4gICAgICAgPGZ1bmMgbGF5b3V0PVwic3ViY29udGVudFwiIGlzX29wZW49XCJZXCIgdWxjbGFzcz1cIlwiIG5hbWU9XCJcdTdEQTBcdTgyNzJcdThGNDlcdTU3OEJcIiBkZXNjcmlwdGlvbj1cIlwiIGlkPVwiZDMxMTFmNjQxNVwiIHBhZ2U9XCJkMzExMWY2NDE1XCIgbGljbGFzcz1cIlwiIGljb25jbGFzcz1cIlwiIHVybD1cIlwiPjxcL2Z1bmM+ICAgICAgIDxmdW5jIGxheW91dD1cInN1YmNvbnRlbnRcIiBpc19vcGVuPVwiWVwiIHVsY2xhc3M9XCJcIiBuYW1lPVwiXHU4Q0FDXHU0RUZCXHU2Mjk1XHU4Q0M3XCIgZGVzY3JpcHRpb249XCJcIiBpZD1cIjg0NjMxOWZkMTVcIiBwYWdlPVwiODQ2MzE5ZmQxNVwiIGxpY2xhc3M9XCJcIiBpY29uY2xhc3M9XCJcIiB1cmw9XCJcIj48XC9mdW5jPiAgICAgICA8ZnVuYyBsYXlvdXQ9XCJzdWJjb250ZW50XCIgaXNfb3Blbj1cIllcIiB1bGNsYXNzPVwiXCIgbmFtZT1cIlx1NzZFMVx1ODA3N1x1NjM4OFx1NEZFMVwiIGRlc2NyaXB0aW9uPVwiXCIgaWQ9XCIxOTg0YWQ3YTE1XCIgcGFnZT1cIjE5ODRhZDdhMTVcIiBsaWNsYXNzPVwiXCIgaWNvbmNsYXNzPVwiXCIgdXJsPVwiXCI+PFwvZnVuYz4gICAgICAgPGZ1bmMgbGF5b3V0PVwic3ViY29udGVudFwiIGlzX29wZW49XCJZXCIgdWxjbGFzcz1cIlwiIG5hbWU9XCJcdThENjRcdTkwNTNcdTUzOUZcdTUyNDdcIiBkZXNjcmlwdGlvbj1cIlwiIGlkPVwiOGJjNDQyNTIxNVwiIHBhZ2U9XCI4YmM0NDI1MjE1XCIgbGljbGFzcz1cIlwiIGljb25jbGFzcz1cIlwiIHVybD1cIlwiPjxcL2Z1bmM+ICAgICAgPFwvZnVuYz4gICAgICA8ZnVuYyBsYXlvdXQ9XCJzdWJjb250ZW50XCIgaXNfb3Blbj1cIllcIiB1bGNsYXNzPVwiXCIgbmFtZT1cIlx1NkMyM1x1NTAxOVx1NjZBOFx1ODFFQVx1NzEzNlx1NzZGOFx1OTVEQ1x1NjNFRFx1OTczMlwiIGRlc2NyaXB0aW9uPVwiXCIgaWQ9XCI5NTZmMGQzZDE1XCIgcGFnZT1cIjk1NmYwZDNkMTVcIiBsaWNsYXNzPVwiXCIgaWNvbmNsYXNzPVwiXCIgdXJsPVwiXCI+PFwvZnVuYz4gICAgICA8ZnVuYyBsYXlvdXQ9XCJzdWJjb250ZW50XCIgaXNfb3Blbj1cIllcIiB1bGNsYXNzPVwiXCIgbmFtZT1cIlx1NUMwRVx1NTE2NVx1NzRCMFx1NTg4M1x1NkMzOFx1N0U4Q1x1NkExOVx1NkU5NlwiIGRlc2NyaXB0aW9uPVwiXCIgaWQ9XCI0OGU3YTVmMzE1XCIgcGFnZT1cIjQ4ZTdhNWYzMTVcIiBsaWNsYXNzPVwiXCIgaWNvbmNsYXNzPVwiXCIgdXJsPVwiXCI+PFwvZnVuYz4gICAgICA8ZnVuYyBsYXlvdXQ9XCJzdWJjb250ZW50XCIgaXNfb3Blbj1cIllcIiB1bGNsYXNzPVwiXCIgbmFtZT1cIlx1NkVBQlx1NUJBNFx1NkMyM1x1OUFENFx1NkUxQlx1OTFDRlx1NTNDQVx1N0JBMVx1NzQwNlwiIGRlc2NyaXB0aW9uPVwiXCIgaWQ9XCJjYTg3ZmIxMTE1XCIgcGFnZT1cImNhODdmYjExMTVcIiBsaWNsYXNzPVwiXCIgaWNvbmNsYXNzPVwiXCIgdXJsPVwiXCI+PFwvZnVuYz4gICAgICA8ZnVuYyBsYXlvdXQ9XCJzdWJjb250ZW50XCIgaXNfb3Blbj1cIllcIiB1bGNsYXNzPVwiXCIgbmFtZT1cIlx1N0RBMFx1ODBGRFx1ODIwN1x1OENDN1x1NkU5MFx1N0JBMVx1NzQwNlwiIGRlc2NyaXB0aW9uPVwiXCIgaWQ9XCJkMTZjZDlkMTE1XCIgcGFnZT1cImQxNmNkOWQxMTVcIiBsaWNsYXNzPVwiXCIgaWNvbmNsYXNzPVwiXCIgdXJsPVwiXCI+PFwvZnVuYz4gICAgICA8ZnVuYyBsYXlvdXQ9XCJzdWJjb250ZW50XCIgaXNfb3Blbj1cIllcIiB1bGNsYXNzPVwiXCIgbmFtZT1cIlx1NkMzOFx1N0U4Q1x1NjNBMVx1OENGQ1x1N0JBMVx1NzQwNlwiIGRlc2NyaXB0aW9uPVwiXCIgaWQ9XCJjMGM3MjU5ZjE1XCIgcGFnZT1cImMwYzcyNTlmMTVcIiBsaWNsYXNzPVwiXCIgaWNvbmNsYXNzPVwiXCIgdXJsPVwiXCI+PFwvZnVuYz4gICAgICA8ZnVuYyBsYXlvdXQ9XCJzdWJjb250ZW50XCIgaXNfb3Blbj1cIllcIiB1bGNsYXNzPVwiXCIgbmFtZT1cIlx1NEY5Qlx1NjFDOVx1NTU0Nlx1N0JBMVx1NzQwNlwiIGRlc2NyaXB0aW9uPVwiXCIgaWQ9XCJhN2I5NDMwYzE1XCIgcGFnZT1cImE3Yjk0MzBjMTVcIiBsaWNsYXNzPVwiXCIgaWNvbmNsYXNzPVwiXCIgdXJsPVwiXCI+PFwvZnVuYz4gICAgICA8ZnVuYyBsYXlvdXQ9XCJzdWJjb250ZW50XCIgaXNfb3Blbj1cIllcIiB1bGNsYXNzPVwiXCIgbmFtZT1cIlx1NkMzOFx1N0U4Q1x1OENDN1x1OEEwQVx1NUMwOFx1NTM0MFwiIGRlc2NyaXB0aW9uPVwiXCIgaWQ9XCIzOGE2N2FhZTE1XCIgcGFnZT1cIjM4YTY3YWFlMTVcIiBsaWNsYXNzPVwiXCIgaWNvbmNsYXNzPVwiXCIgdXJsPVwiXCI+PFwvZnVuYz4gICAgIDxcL2Z1bmM+ICAgICA8ZnVuYyBsYXlvdXQ9XCJcIiBpc19vcGVuPVwiWVwiIHVsY2xhc3M9XCJcIiBuYW1lPVwiXHU1RTc4XHU3OThGXHU4MDc3XHU1ODM0IFx1NzkzRVx1NjcwM1x1NTE3MVx1ODc4RFwiIGRlc2NyaXB0aW9uPVwiXCIgaWQ9XCI2OTAzOTQwMTE1XCIgcGFnZT1cIlwiIGxpY2xhc3M9XCJcIiBpY29uY2xhc3M9XCJcIiB1cmw9XCJcIj4gICAgICA8ZnVuYyBsYXlvdXQ9XCJzdWJjb250ZW50XCIgaXNfb3Blbj1cIllcIiB1bGNsYXNzPVwiXCIgbmFtZT1cIlx1NEVCQVx1NkIwQVx1NEZERFx1OTY5Q1x1ODIwN1x1NTkxQVx1NTE0M1x1NUU3M1x1N0I0OVwiIGRlc2NyaXB0aW9uPVwiXCIgaWQ9XCI4NWQ2ODNhMDE1XCIgcGFnZT1cIjg1ZDY4M2EwMTVcIiBsaWNsYXNzPVwiXCIgaWNvbmNsYXNzPVwiXCIgdXJsPVwiXCI+PFwvZnVuYz4gICAgICA8ZnVuYyBsYXlvdXQ9XCJzdWJjb250ZW50XCIgaXNfb3Blbj1cIllcIiB1bGNsYXNzPVwiXCIgbmFtZT1cIlx1NEVCQVx1NjI0RFx1NTQzOFx1NUYxNVx1ODIwN1x1NzU1OVx1NEVGQlwiIGRlc2NyaXB0aW9uPVwiXCIgaWQ9XCIwNjY5ZDNiZTE1XCIgcGFnZT1cIjA2NjlkM2JlMTVcIiBsaWNsYXNzPVwiXCIgaWNvbmNsYXNzPVwiXCIgdXJsPVwiXCI+PFwvZnVuYz4gICAgICA8ZnVuYyBsYXlvdXQ9XCJzdWJjb250ZW50XCIgaXNfb3Blbj1cIllcIiB1bGNsYXNzPVwiXCIgbmFtZT1cIlx1NTRFMVx1NURFNVx1NTdGOVx1NTI5Qlx1NzY3Q1x1NUM1NVwiIGRlc2NyaXB0aW9uPVwiXCIgaWQ9XCJhZTE2NDVlYTE1XCIgcGFnZT1cImFlMTY0NWVhMTVcIiBsaWNsYXNzPVwiXCIgaWNvbmNsYXNzPVwiXCIgdXJsPVwiXCI+PFwvZnVuYz4gICAgICA8ZnVuYyBsYXlvdXQ9XCJzdWJjb250ZW50XCIgaXNfb3Blbj1cIllcIiB1bGNsYXNzPVwiXCIgbmFtZT1cIlx1ODA3N1x1Njk2RFx1NUI4OVx1NTE2OFx1ODIwN1x1NTA2NVx1NUVCN1wiIGRlc2NyaXB0aW9uPVwiXCIgaWQ9XCJkM2FhOWJkYzE1XCIgcGFnZT1cImQzYWE5YmRjMTVcIiBsaWNsYXNzPVwiXCIgaWNvbmNsYXNzPVwiXCIgdXJsPVwiXCI+PFwvZnVuYz4gICAgICA8ZnVuYyBsYXlvdXQ9XCJzdWJjb250ZW50XCIgaXNfb3Blbj1cIllcIiB1bGNsYXNzPVwiXCIgbmFtZT1cIlx1NTE2Q1x1NzZDQVx1N0I1Nlx1NzU2NVx1ODIwN1x1NUY3MVx1OTdGRlx1NTI5QlwiIGRlc2NyaXB0aW9uPVwiXCIgaWQ9XCJlZThlODI4ZDE1XCIgcGFnZT1cImVlOGU4MjhkMTVcIiBsaWNsYXNzPVwiXCIgaWNvbmNsYXNzPVwiXCIgdXJsPVwiXCI+PFwvZnVuYz4gICAgICA8ZnVuYyBsYXlvdXQ9XCJzdWJjb250ZW50XCIgaXNfb3Blbj1cIllcIiB1bGNsYXNzPVwiXCIgbmFtZT1cIlx1OTc1RVx1OENBMVx1NTJEOVx1OTFEMVx1ODc4RFx1NjUyRlx1NjMwMVwiIGRlc2NyaXB0aW9uPVwiXCIgaWQ9XCI4NjFjMzAzZjE1XCIgcGFnZT1cIjg2MWMzMDNmMTVcIiBsaWNsYXNzPVwiXCIgaWNvbmNsYXNzPVwiXCIgdXJsPVwiXCI+PFwvZnVuYz4gICAgIDxcL2Z1bmM+ICAgICA8ZnVuYyBsYXlvdXQ9XCJcIiBpc19vcGVuPVwiWVwiIHVsY2xhc3M9XCJcIiBuYW1lPVwiXHU2OUFFXHU4MDAwXHU4MjA3XHU4MEFGXHU1QjlBXCIgZGVzY3JpcHRpb249XCJcIiBpZD1cImVmNzdmYTkyMTVcIiBwYWdlPVwiXCIgbGljbGFzcz1cIlwiIGljb25jbGFzcz1cIlwiIHVybD1cIlwiPiAgICAgIDxmdW5jIGxheW91dD1cInN1YmNvbnRlbnRcIiBpc19vcGVuPVwiWVwiIHVsY2xhc3M9XCJcIiBuYW1lPVwiXHU0RjAxXHU2OTZEXHU2QzM4XHU3RThDXHU3RTNFXHU2NTQ4XCIgZGVzY3JpcHRpb249XCJcIiBpZD1cIjg0NWI3ZmJjMTVcIiBwYWdlPVwiODQ1YjdmYmMxNVwiIGxpY2xhc3M9XCJcIiBpY29uY2xhc3M9XCJcIiB1cmw9XCJcIj48XC9mdW5jPiAgICAgIDxmdW5jIGxheW91dD1cInN1YmNvbnRlbnRcIiBpc19vcGVuPVwiWVwiIHVsY2xhc3M9XCJcIiBuYW1lPVwiXHU1NzBCXHU5NjlCXHU4QThEXHU4QjQ5XHU2QTE5XHU3QUUwXCIgZGVzY3JpcHRpb249XCJcIiBpZD1cIjUxMjU0MGNmMTVcIiBwYWdlPVwiNTEyNTQwY2YxNVwiIGxpY2xhc3M9XCJcIiBpY29uY2xhc3M9XCJcIiB1cmw9XCJcIj48XC9mdW5jPiAgICAgIDxmdW5jIGxheW91dD1cInN1YmNvbnRlbnRcIiBpc19vcGVuPVwiWVwiIHVsY2xhc3M9XCJcIiBuYW1lPVwiXHU3ODE0XHU4QTBFXHU1RUE3XHU4QUM3XCIgZGVzY3JpcHRpb249XCJcIiBpZD1cIjJkYjk0ZWY4MTdcIiBwYWdlPVwiMmRiOTRlZjgxN1wiIGxpY2xhc3M9XCJcIiBpY29uY2xhc3M9XCJcIiB1cmw9XCJcIj48XC9mdW5jPiAgICAgPFwvZnVuYz4gICAgIDxmdW5jIGxheW91dD1cIlwiIGlzX29wZW49XCJZXCIgdWxjbGFzcz1cIlwiIG5hbWU9XCJcdTUzQ0JcdTU1ODRcdTkwMjNcdTdENTBcIiBkZXNjcmlwdGlvbj1cIlwiIGlkPVwiYTA1OTRlNWIxNVwiIHBhZ2U9XCJcIiBsaWNsYXNzPVwiXCIgaWNvbmNsYXNzPVwiXCIgdXJsPVwiXCI+ICAgICAgPGZ1bmMgbGF5b3V0PVwic3ViY29udGVudFwiIGlzX29wZW49XCJZXCIgdWxjbGFzcz1cIlwiIG5hbWU9XCJcdTUzQ0JcdTU1ODRcdTkwMjNcdTdENTBcdTVFNzNcdTUzRjBcIiBkZXNjcmlwdGlvbj1cIlwiIGlkPVwiYmMwNWNjM2IxNVwiIHBhZ2U9XCJiYzA1Y2MzYjE1XCIgbGljbGFzcz1cIlwiIGljb25jbGFzcz1cIlwiIHVybD1cIlwiPjxcL2Z1bmM+ICAgICA8XC9mdW5jPiAgICAgPGZ1bmMgbGF5b3V0PVwiXCIgaXNfb3Blbj1cIllcIiB1bGNsYXNzPVwiXCIgbmFtZT1cIlx1OTFEMVx1ODc4RFx1NTkyN1x1NTZERVx1OTk0Qlx1NUMwOFx1NTM0MFwiIGRlc2NyaXB0aW9uPVwiXCIgaWQ9XCJmMDg0OWM0NDE3XCIgcGFnZT1cIlwiIGxpY2xhc3M9XCJcIiBpY29uY2xhc3M9XCJcIiB1cmw9XCJcIj4gICAgICA8ZnVuYyBsYXlvdXQ9XCJzdWJjb250ZW50XCIgaXNfb3Blbj1cIllcIiB1bGNsYXNzPVwiXCIgbmFtZT1cIlx1OTFEMVx1ODc4RFx1NjU1OVx1ODBCMlx1ODIwN1x1N0QyMFx1OTkwQVx1NjNEMFx1NTM0N1wiIGRlc2NyaXB0aW9uPVwiXCIgaWQ9XCI0ZDMxNzAxNDE3XCIgcGFnZT1cIjRkMzE3MDE0MTdcIiBsaWNsYXNzPVwiXCIgaWNvbmNsYXNzPVwiXCIgdXJsPVwiXCI+PFwvZnVuYz4gICAgICA8ZnVuYyBsYXlvdXQ9XCJzdWJjb250ZW50XCIgaXNfb3Blbj1cIllcIiB1bGNsYXNzPVwiXCIgbmFtZT1cIlx1NjUyRlx1NjMwMVx1NTczMFx1NjVCOVx1ODIwN1x1NUYzMVx1NTJFMlx1NzY3Q1x1NUM1NVwiIGRlc2NyaXB0aW9uPVwiXCIgaWQ9XCJlZTk4NzM2NDE3XCIgcGFnZT1cImVlOTg3MzY0MTdcIiBsaWNsYXNzPVwiXCIgaWNvbmNsYXNzPVwiXCIgdXJsPVwiXCI+PFwvZnVuYz4gICAgICA8ZnVuYyBsYXlvdXQ9XCJzdWJjb250ZW50XCIgaXNfb3Blbj1cIllcIiB1bGNsYXNzPVwiXCIgbmFtZT1cIlx1N0RBMFx1ODI3Mlx1OTFEMVx1ODc4RFx1ODIwN1x1NkMzOFx1N0U4Q1x1NzY3Q1x1NUM1NVwiIGRlc2NyaXB0aW9uPVwiXCIgaWQ9XCIzNWRjZWE3ZjE3XCIgcGFnZT1cIjM1ZGNlYTdmMTdcIiBsaWNsYXNzPVwiXCIgaWNvbmNsYXNzPVwiXCIgdXJsPVwiXCI+PFwvZnVuYz4gICAgICA8ZnVuYyBsYXlvdXQ9XCJzdWJjb250ZW50XCIgaXNfb3Blbj1cIllcIiB1bGNsYXNzPVwiXCIgbmFtZT1cIlx1NTU4NFx1NzZFMVx1NzkzRVx1NjcwM1x1OENBQ1x1NEVGQlwiIGRlc2NyaXB0aW9uPVwiXCIgaWQ9XCIzNzZlODI2NjE3XCIgcGFnZT1cIjM3NmU4MjY2MTdcIiBsaWNsYXNzPVwiXCIgaWNvbmNsYXNzPVwiXCIgdXJsPVwiXCI+PFwvZnVuYz4gICAgIDxcL2Z1bmM+ICAgIDxcL2Z1bmM+ICAgIDxmdW5jIGxheW91dD1cIlwiIGlzX29wZW49XCJZXCIgdWxjbGFzcz1cIlwiIG5hbWU9XCJcdTUyNkZcdTkwNzhcdTU1QUVcIiBkZXNjcmlwdGlvbj1cIlwiIGlkPVwidG9wbWVudTFcIiBwYWdlPVwiXCIgbGljbGFzcz1cIlwiIGljb25jbGFzcz1cIlwiIHVybD1cIlwiPiAgICAgPGZ1bmMgbGF5b3V0PVwiXCIgaXNfb3Blbj1cIllcIiB1bGNsYXNzPVwiXCIgbmFtZT1cIkVOR0xJU0hcIiBkZXNjcmlwdGlvbj1cIlwiIGlkPVwiNTM2ZmJhODYxNVwiIHBhZ2U9XCJcIiBsaWNsYXNzPVwiXCIgaWNvbmNsYXNzPVwiXCIgdXJsPVwiaW5kZXhfZW5nLmpzcFwiPjxcL2Z1bmM+ICAgICA8ZnVuYyBsYXlvdXQ9XCJcIiBpc19vcGVuPVwiWVwiIHVsY2xhc3M9XCJcIiBuYW1lPVwiXHU1Qjk4XHU3REIyXHU5OTk2XHU5ODAxXCIgZGVzY3JpcHRpb249XCJcIiBpZD1cIjRjNGUwYjQ0MTVcIiBwYWdlPVwiXCIgbGljbGFzcz1cIlwiIGljb25jbGFzcz1cIlwiIHVybD1cImh0dHBzOlwvXC93d3cuYmFua2NoYi5jb21cIj48XC9mdW5jPiAgICAgPGZ1bmMgbGF5b3V0PVwiXCIgaXNfb3Blbj1cIllcIiB1bGNsYXNzPVwiXCIgbmFtZT1cIlx1N0RCMlx1N0FEOVx1NUMwRVx1ODlCRFwiIGRlc2NyaXB0aW9uPVwiXCIgaWQ9XCJzaXRlbWFwXCIgcGFnZT1cIlwiIGxpY2xhc3M9XCJcIiBpY29uY2xhc3M9XCJcIiB1cmw9XCJzaXRlbWFwLmpzcFwiPjxcL2Z1bmM+ICAgIDxcL2Z1bmM+ICAgIDxmdW5jIGxheW91dD1cInN1YmFyZWFfZnVsbFwiIGlzX29wZW49XCJZXCIgdWxjbGFzcz1cIlwiIG5hbWU9XCJIb21lXCIgZGVzY3JpcHRpb249XCJIb21lXCIgaWQ9XCJpbmRleF9lbmdcIiBwYWdlPVwiaW5kZXhfZW5nXCIgbGljbGFzcz1cIlwiIGljb25jbGFzcz1cIlwiIHVybD1cIlwiPiAgICAgPGZ1bmMgbGF5b3V0PVwic3ViYXJlYV9lbmdcIiBpc19vcGVuPVwiWVwiIHVsY2xhc3M9XCJcIiBuYW1lPVwiTWVzc2FnZSBmcm9tIHRoZSBDaGFpcnBlcnNvblwiIGRlc2NyaXB0aW9uPVwiXCIgaWQ9XCIyNmZjOGFiYTE1XCIgcGFnZT1cIjI2ZmM4YWJhMTVcIiBsaWNsYXNzPVwiXCIgaWNvbmNsYXNzPVwiXCIgdXJsPVwiXCI+PFwvZnVuYz4gICAgIDxmdW5jIGxheW91dD1cIlwiIGlzX29wZW49XCJZXCIgdWxjbGFzcz1cIlwiIG5hbWU9XCJNZWNoYW5pc20gb2YgU3VzdGFpbmFibGUgRGV2ZWxvcG1lbnRcIiBkZXNjcmlwdGlvbj1cIlwiIGlkPVwiOGE1ZTU3Y2ExNVwiIHBhZ2U9XCJcIiBsaWNsYXNzPVwiXCIgaWNvbmNsYXNzPVwiXCIgdXJsPVwiXCI+ICAgICAgPGZ1bmMgbGF5b3V0PVwic3ViY29udGVudF9lbmdcIiBpc19vcGVuPVwiWVwiIHVsY2xhc3M9XCJcIiBuYW1lPVwiT3JnYW5pemF0aW9uIGFuZCBNZWNoYW5pc20gb2YgU3VzdGFpbmFibGUgRGV2ZWxvcG1lbnRcIiBkZXNjcmlwdGlvbj1cIlwiIGlkPVwiY2MwY2RiNTMxNVwiIHBhZ2U9XCJjYzBjZGI1MzE1XCIgbGljbGFzcz1cIlwiIGljb25jbGFzcz1cIlwiIHVybD1cIlwiPjxcL2Z1bmM+ICAgICAgPGZ1bmMgbGF5b3V0PVwiXCIgaXNfb3Blbj1cIllcIiB1bGNsYXNzPVwiXCIgbmFtZT1cIlN0YWtlaG9sZGVyIEVuZ2FnZW1lbnQgYW5kIE1hdGVyaWFsIFRvcGljcyBBbmFseXNpc1wiIGRlc2NyaXB0aW9uPVwiXCIgaWQ9XCJiODI4ZWI0NjE1XCIgcGFnZT1cIlwiIGxpY2xhc3M9XCJcIiBpY29uY2xhc3M9XCJcIiB1cmw9XCJcIj4gICAgICAgPGZ1bmMgbGF5b3V0PVwic3ViY29udGVudF9lbmdcIiBpc19vcGVuPVwiWVwiIHVsY2xhc3M9XCJcIiBuYW1lPVwiTWF0ZXJpYWwgVG9waWNzIEFuYWx5c2lzXCIgZGVzY3JpcHRpb249XCJcIiBpZD1cImVmZGFiMmIzMTVcIiBwYWdlPVwiZWZkYWIyYjMxNVwiIGxpY2xhc3M9XCJcIiBpY29uY2xhc3M9XCJcIiB1cmw9XCJcIj48XC9mdW5jPiAgICAgICA8ZnVuYyBsYXlvdXQ9XCJzdWJjb250ZW50X2VuZ1wiIGlzX29wZW49XCJZXCIgdWxjbGFzcz1cIlwiIG5hbWU9XCJUaGUgaW1wb3J0YW5jZSBhbmQgaW1wYWN0IG9mIE1hdGVyaWFsIFRvcGljXCIgZGVzY3JpcHRpb249XCJcIiBpZD1cIjI2MDdlOGU2MTVcIiBwYWdlPVwiMjYwN2U4ZTYxNVwiIGxpY2xhc3M9XCJcIiBpY29uY2xhc3M9XCJcIiB1cmw9XCJcIj48XC9mdW5jPiAgICAgICA8ZnVuYyBsYXlvdXQ9XCJzdWJjb250ZW50X2VuZ1wiIGlzX29wZW49XCJZXCIgdWxjbGFzcz1cIlwiIG5hbWU9XCJTdW1tYXJ5IG9mIFN0YWtlaG9sZGVyIENvbW11bmljYXRpb24gQ2hhbm5lbHMgYW5kIENvbmNlcm5lZCBUb3BpY3NcIiBkZXNjcmlwdGlvbj1cIlwiIGlkPVwiNWQ3YmZjNDIxNVwiIHBhZ2U9XCI1ZDdiZmM0MjE1XCIgbGljbGFzcz1cIlwiIGljb25jbGFzcz1cIlwiIHVybD1cIlwiPjxcL2Z1bmM+ICAgICAgIDxmdW5jIGxheW91dD1cInN1YmNvbnRlbnRfZW5nXCIgaXNfb3Blbj1cIllcIiB1bGNsYXNzPVwiXCIgbmFtZT1cIk1hbmFnZW1lbnQgYW5kIFRhcmdldCBvZiBNYWpvciBUb3BpY3NcIiBkZXNjcmlwdGlvbj1cIlwiIGlkPVwiM2RkZGRiOWMxNVwiIHBhZ2U9XCIzZGRkZGI5YzE1XCIgbGljbGFzcz1cIlwiIGljb25jbGFzcz1cIlwiIHVybD1cIlwiPjxcL2Z1bmM+ICAgICAgPFwvZnVuYz4gICAgICA8ZnVuYyBsYXlvdXQ9XCJcIiBpc19vcGVuPVwiWVwiIHVsY2xhc3M9XCJcIiBuYW1lPVwiRVNHXC9DU1IgUmVwb3J0c1wiIGRlc2NyaXB0aW9uPVwiXCIgaWQ9XCJkNzc2MmJjMDE1XCIgcGFnZT1cIlwiIGxpY2xhc3M9XCJcIiBpY29uY2xhc3M9XCJcIiB1cmw9XCJodHRwczpcL1wvd3d3LmJhbmtjaGIuY29tXC9jc3JcL21hc2h1cF9lbmcuanNwP2Z1bmNJZD02ZGI4NzI1MjE1XCI+PFwvZnVuYz4gICAgICA8ZnVuYyBsYXlvdXQ9XCJcIiBpc19vcGVuPVwiWVwiIHVsY2xhc3M9XCJcIiBuYW1lPVwiU3Rha2Vob2xkZXIgUXVlc3Rpb25uYWlyZVwiIGRlc2NyaXB0aW9uPVwiXCIgaWQ9XCJiYmRhNDkwMTE1XCIgcGFnZT1cIlwiIGxpY2xhc3M9XCJcIiBpY29uY2xhc3M9XCJcIiB1cmw9XCJodHRwczpcL1wvd3d3LmJhbmtjaGIuY29tXC9mcm9udGVuZFwvc3Rha2Vob2xkZXJRdWVzdGlvbi5qc3A/bGFuZz1lbl91c1wiPjxcL2Z1bmM+ICAgICA8XC9mdW5jPiAgICAgPGZ1bmMgbGF5b3V0PVwiXCIgaXNfb3Blbj1cIllcIiB1bGNsYXNzPVwiXCIgbmFtZT1cIlN1c3RhaW5hYmxlIFJlc2lsaWVuY2VcIiBkZXNjcmlwdGlvbj1cIlwiIGlkPVwiMmUzMzNlNTMxNVwiIHBhZ2U9XCJcIiBsaWNsYXNzPVwiXCIgaWNvbmNsYXNzPVwiXCIgdXJsPVwiXCI+ICAgICAgPGZ1bmMgbGF5b3V0PVwiXCIgaXNfb3Blbj1cIllcIiB1bGNsYXNzPVwiXCIgbmFtZT1cIkNvbXBhbnkgUHJvZmlsZVwiIGRlc2NyaXB0aW9uPVwiXCIgaWQ9XCI1NzI4NTE4MzE1XCIgcGFnZT1cIlwiIGxpY2xhc3M9XCJcIiBpY29uY2xhc3M9XCJcIiB1cmw9XCJcIj4gICAgICAgPGZ1bmMgbGF5b3V0PVwic3ViY29udGVudF9lbmdcIiBpc19vcGVuPVwiWVwiIHVsY2xhc3M9XCJcIiBuYW1lPVwiQ29tcGFueSBQcm9maWxlXCIgZGVzY3JpcHRpb249XCJcIiBpZD1cIjdmYWU4YTNkMTVcIiBwYWdlPVwiN2ZhZThhM2QxNVwiIGxpY2xhc3M9XCJcIiBpY29uY2xhc3M9XCJcIiB1cmw9XCJcIj48XC9mdW5jPiAgICAgICA8ZnVuYyBsYXlvdXQ9XCJzdWJjb250ZW50X2VuZ1wiIGlzX29wZW49XCJZXCIgdWxjbGFzcz1cIlwiIG5hbWU9XCJCdXNpbmVzcyBQZXJmb3JtYW5jZSBhbmQgVGF4IEdvdmVybmFuY2VcIiBkZXNjcmlwdGlvbj1cIlwiIGlkPVwiNDVlZTE4ZDkxNVwiIHBhZ2U9XCI0NWVlMThkOTE1XCIgbGljbGFzcz1cIlwiIGljb25jbGFzcz1cIlwiIHVybD1cIlwiPjxcL2Z1bmM+ICAgICAgPFwvZnVuYz4gICAgICA8ZnVuYyBsYXlvdXQ9XCJcIiBpc19vcGVuPVwiWVwiIHVsY2xhc3M9XCJcIiBuYW1lPVwiQ29ycG9yYXRlIEdvdmVybmFuY2VcIiBkZXNjcmlwdGlvbj1cIlwiIGlkPVwiOGM0MGU4NTcxNVwiIHBhZ2U9XCJcIiBsaWNsYXNzPVwiXCIgaWNvbmNsYXNzPVwiXCIgdXJsPVwiXCI+ICAgICAgIDxmdW5jIGxheW91dD1cInN1YmNvbnRlbnRfZW5nXCIgaXNfb3Blbj1cIllcIiB1bGNsYXNzPVwiXCIgbmFtZT1cIkNvcnBvcmF0ZSBHb3Zlcm5hbmNlIEZyYW13b3JrICZhbXA7IHRoZSBCb2FyZCBvZiBEaXJlY3RvcnNcIiBkZXNjcmlwdGlvbj1cIlwiIGlkPVwiNGE2MmNkNmIxNVwiIHBhZ2U9XCI0YTYyY2Q2YjE1XCIgbGljbGFzcz1cIlwiIGljb25jbGFzcz1cIlwiIHVybD1cIlwiPjxcL2Z1bmM+ICAgICAgIDxmdW5jIGxheW91dD1cInN1YmNvbnRlbnRfZW5nXCIgaXNfb3Blbj1cIllcIiB1bGNsYXNzPVwiXCIgbmFtZT1cIlBlcmZvcm1hbmNlICZhbXA7IFJlbXVuZXJhdGlvbiBvZiBCb2FyZCBvZiBEaXJlY3RvcnNcIiBkZXNjcmlwdGlvbj1cIlwiIGlkPVwiMjhiNzk0YWQxNVwiIHBhZ2U9XCIyOGI3OTRhZDE1XCIgbGljbGFzcz1cIlwiIGljb25jbGFzcz1cIlwiIHVybD1cIlwiPjxcL2Z1bmM+ICAgICAgIDxmdW5jIGxheW91dD1cInN1YmNvbnRlbnRfZW5nXCIgaXNfb3Blbj1cIllcIiB1bGNsYXNzPVwiXCIgbmFtZT1cIlBhcnRpY2lwYXRpbmcgaW4gVHJhZGUgQXNzb2NpYXRpb25zIGFuZCBMb2JieWluZ1wiIGRlc2NyaXB0aW9uPVwiXCIgaWQ9XCI2ZjkzNjM4ZDE1XCIgcGFnZT1cIjZmOTM2MzhkMTVcIiBsaWNsYXNzPVwiXCIgaWNvbmNsYXNzPVwiXCIgdXJsPVwiXCI+PFwvZnVuYz4gICAgICA8XC9mdW5jPiAgICAgIDxmdW5jIGxheW91dD1cInN1YmNvbnRlbnRfZW5nXCIgaXNfb3Blbj1cIllcIiB1bGNsYXNzPVwiXCIgbmFtZT1cIkJ1c2luZXNzIEludGVncml0eVwiIGRlc2NyaXB0aW9uPVwiXCIgaWQ9XCIwOGYwZmY5YzE2XCIgcGFnZT1cIjA4ZjBmZjljMTZcIiBsaWNsYXNzPVwiXCIgaWNvbmNsYXNzPVwiXCIgdXJsPVwiXCI+PFwvZnVuYz4gICAgICA8ZnVuYyBsYXlvdXQ9XCJzdWJjb250ZW50X2VuZ1wiIGlzX29wZW49XCJZXCIgdWxjbGFzcz1cIlwiIG5hbWU9XCJDb21wbGlhbmNlXCIgZGVzY3JpcHRpb249XCJcIiBpZD1cIjkzMDExZGMxMTVcIiBwYWdlPVwiOTMwMTFkYzExNVwiIGxpY2xhc3M9XCJcIiBpY29uY2xhc3M9XCJcIiB1cmw9XCJcIj48XC9mdW5jPiAgICAgIDxmdW5jIGxheW91dD1cInN1YmNvbnRlbnRfZW5nXCIgaXNfb3Blbj1cIllcIiB1bGNsYXNzPVwiXCIgbmFtZT1cIkFudGktTW9uZXkgTGF1bmRlcmluZyBhbmQgQ291bnRlcmluZyBGaW5hbmNpbmcgb2YgVGVycm9yaXNtXCIgZGVzY3JpcHRpb249XCJcIiBpZD1cImMxODU4NDkwMTVcIiBwYWdlPVwiYzE4NTg0OTAxNVwiIGxpY2xhc3M9XCJcIiBpY29uY2xhc3M9XCJcIiB1cmw9XCJcIj48XC9mdW5jPiAgICAgIDxmdW5jIGxheW91dD1cInN1YmNvbnRlbnRfZW5nXCIgaXNfb3Blbj1cIllcIiB1bGNsYXNzPVwiXCIgbmFtZT1cIlJpc2sgTWFuYWdlbWVudCBhbmQgQXVkaXRcIiBkZXNjcmlwdGlvbj1cIlwiIGlkPVwiYWU5ODZlNGMxNVwiIHBhZ2U9XCJhZTk4NmU0YzE1XCIgbGljbGFzcz1cIlwiIGljb25jbGFzcz1cIlwiIHVybD1cIlwiPiAgICAgICA8ZnVuYyBsYXlvdXQ9XCJzdWJjb250ZW50X2VuZ1wiIGlzX29wZW49XCJZXCIgdWxjbGFzcz1cIlwiIG5hbWU9XCJSaXNrIE1hbmFnZW1lbnQgYW5kIEF1ZGl0XCIgZGVzY3JpcHRpb249XCJcIiBpZD1cIjI2YmJkYWQ0MTZcIiBwYWdlPVwiMjZiYmRhZDQxNlwiIGxpY2xhc3M9XCJcIiBpY29uY2xhc3M9XCJcIiB1cmw9XCJcIj48XC9mdW5jPiAgICAgICA8ZnVuYyBsYXlvdXQ9XCJzdWJjb250ZW50X2VuZ1wiIGlzX29wZW49XCJZXCIgdWxjbGFzcz1cIlwiIG5hbWU9XCJFbWVyZ2luZyBSaXNrIE1hbmFnZW1lbnRcIiBkZXNjcmlwdGlvbj1cIlwiIGlkPVwiMDZkNjczYzYxNlwiIHBhZ2U9XCIwNmQ2NzNjNjE2XCIgbGljbGFzcz1cIlwiIGljb25jbGFzcz1cIlwiIHVybD1cIlwiPjxcL2Z1bmM+ICAgICAgIDxmdW5jIGxheW91dD1cInN1YmNvbnRlbnRfZW5nXCIgaXNfb3Blbj1cIllcIiB1bGNsYXNzPVwiXCIgbmFtZT1cIkludGVsbGVjdHVhbCBQcm9wZXJ0eSBNYW5hZ2VtZW50XCIgZGVzY3JpcHRpb249XCJcIiBpZD1cIjYwMDMwNzZhMTZcIiBwYWdlPVwiNjAwMzA3NmExNlwiIGxpY2xhc3M9XCJcIiBpY29uY2xhc3M9XCJcIiB1cmw9XCJcIj48XC9mdW5jPiAgICAgIDxcL2Z1bmM+ICAgICAgPGZ1bmMgbGF5b3V0PVwiXCIgaXNfb3Blbj1cIllcIiB1bGNsYXNzPVwiXCIgbmFtZT1cIkluZm9ybWF0aW9uIFNlY3VyaXR5IGFuZCBEYXRhIFByaXZhY3lcIiBkZXNjcmlwdGlvbj1cIlwiIGlkPVwiNWRiM2NjY2ExNVwiIHBhZ2U9XCJcIiBsaWNsYXNzPVwiXCIgaWNvbmNsYXNzPVwiXCIgdXJsPVwiXCI+ICAgICAgIDxmdW5jIGxheW91dD1cInN1YmNvbnRlbnRfZW5nXCIgaXNfb3Blbj1cIllcIiB1bGNsYXNzPVwiXCIgbmFtZT1cIkluZm9ybWF0aW9uIFNlY3VyaXR5IE1lY2hhbmlzbVwiIGRlc2NyaXB0aW9uPVwiXCIgaWQ9XCI5ZmZmNzVlMzE1XCIgcGFnZT1cIjlmZmY3NWUzMTVcIiBsaWNsYXNzPVwiXCIgaWNvbmNsYXNzPVwiXCIgdXJsPVwiXCI+PFwvZnVuYz4gICAgICAgPGZ1bmMgbGF5b3V0PVwic3ViY29udGVudF9lbmdcIiBpc19vcGVuPVwiWVwiIHVsY2xhc3M9XCJcIiBuYW1lPVwiUGVyc29uYWwgSW5mb3JtYXRpb24gUHJvdGVjdGlvblwiIGRlc2NyaXB0aW9uPVwiXCIgaWQ9XCJiMzc5MjRhZDE1XCIgcGFnZT1cImIzNzkyNGFkMTVcIiBsaWNsYXNzPVwiXCIgaWNvbmNsYXNzPVwiXCIgdXJsPVwiXCI+PFwvZnVuYz4gICAgICA8XC9mdW5jPiAgICAgPFwvZnVuYz4gICAgIDxmdW5jIGxheW91dD1cIlwiIGlzX29wZW49XCJZXCIgdWxjbGFzcz1cIlwiIG5hbWU9XCJTdXN0YWluYWJsZSBFbnZpcm9ubWVudCBhbmQgRmluYW5jZVwiIGRlc2NyaXB0aW9uPVwiXCIgaWQ9XCI4Y2VlYzdlNDE1XCIgcGFnZT1cIlwiIGxpY2xhc3M9XCJcIiBpY29uY2xhc3M9XCJcIiB1cmw9XCJcIj4gICAgICA8ZnVuYyBsYXlvdXQ9XCJcIiBpc19vcGVuPVwiWVwiIHVsY2xhc3M9XCJcIiBuYW1lPVwiQ2xpbWF0ZS0gYW5kIE5hdHVyZS1SZWxhdGVkIERpc2Nsb3N1cmVzXCIgZGVzY3JpcHRpb249XCJcIiBpZD1cIjFjNmJhYjdmMTVcIiBwYWdlPVwiXCIgbGljbGFzcz1cIlwiIGljb25jbGFzcz1cIlwiIHVybD1cIlwiPiAgICAgICA8ZnVuYyBsYXlvdXQ9XCJzdWJjb250ZW50X2VuZ1wiIGlzX29wZW49XCJZXCIgdWxjbGFzcz1cIlwiIG5hbWU9XCJDbGltYXRlLWFuZCBOYXR1cmUtUmVsYXRlZCBEaXNjbG9zdXJlc1wiIGRlc2NyaXB0aW9uPVwiXCIgaWQ9XCI1NmQzNWJjYzE1XCIgcGFnZT1cIjU2ZDM1YmNjMTVcIiBsaWNsYXNzPVwiXCIgaWNvbmNsYXNzPVwiXCIgdXJsPVwiXCI+PFwvZnVuYz4gICAgICAgPGZ1bmMgbGF5b3V0PVwic3ViY29udGVudFwiIGlzX29wZW49XCJZXCIgdWxjbGFzcz1cIlwiIG5hbWU9XCJDbGltYXRlIGFuZCBOYXR1cmUgUmlzayBNYW5hZ2VtZW50XCIgZGVzY3JpcHRpb249XCJcIiBpZD1cIjRlYmM3MTA3MTVcIiBwYWdlPVwiNGViYzcxMDcxNVwiIGxpY2xhc3M9XCJcIiBpY29uY2xhc3M9XCJcIiB1cmw9XCJcIj48XC9mdW5jPiAgICAgIDxcL2Z1bmM+ICAgICAgPGZ1bmMgbGF5b3V0PVwic3ViY29udGVudF9lbmdcIiBpc19vcGVuPVwiWVwiIHVsY2xhc3M9XCJcIiBuYW1lPVwiR3JlZW5ob3VzZSBHYXMgUmVkdWN0aW9uIGFuZCBNYW5hZ2VtZW50XCIgZGVzY3JpcHRpb249XCJcIiBpZD1cIjNmNjRmMWIyMTVcIiBwYWdlPVwiM2Y2NGYxYjIxNVwiIGxpY2xhc3M9XCJcIiBpY29uY2xhc3M9XCJcIiB1cmw9XCJcIj48XC9mdW5jPiAgICAgIDxmdW5jIGxheW91dD1cInN1YmNvbnRlbnRcIiBpc19vcGVuPVwiWVwiIHVsY2xhc3M9XCJcIiBuYW1lPVwiU3VzdGFpbmFibGUgRW5lcmd5IGFuZCBSZXNvdXJjZSBNYW5hZ2VtZW50XCIgZGVzY3JpcHRpb249XCJcIiBpZD1cIjZjZTdiNTRlMTVcIiBwYWdlPVwiNmNlN2I1NGUxNVwiIGxpY2xhc3M9XCJcIiBpY29uY2xhc3M9XCJcIiB1cmw9XCJcIj48XC9mdW5jPiAgICAgIDxmdW5jIGxheW91dD1cInN1YmNvbnRlbnRfZW5nXCIgaXNfb3Blbj1cIllcIiB1bGNsYXNzPVwiXCIgbmFtZT1cIlN1c3RhaW5hYmxlIFByb2N1cmVtZW50IE1hbmFnZW1lbnRcIiBkZXNjcmlwdGlvbj1cIlwiIGlkPVwiYzE1YTQ4MjgxNVwiIHBhZ2U9XCJjMTVhNDgyODE1XCIgbGljbGFzcz1cIlwiIGljb25jbGFzcz1cIlwiIHVybD1cIlwiPjxcL2Z1bmM+ICAgICAgPGZ1bmMgbGF5b3V0PVwic3ViY29udGVudF9lbmdcIiBpc19vcGVuPVwiWVwiIHVsY2xhc3M9XCJcIiBuYW1lPVwiUmVzcG9uc2libGUgRmluYW5jZVwiIGRlc2NyaXB0aW9uPVwiXCIgaWQ9XCJiZWI2MTlhZDE1XCIgcGFnZT1cImJlYjYxOWFkMTVcIiBsaWNsYXNzPVwiXCIgaWNvbmNsYXNzPVwiXCIgdXJsPVwiXCI+ICAgICAgIDxmdW5jIGxheW91dD1cInN1YmNvbnRlbnRfZW5nXCIgaXNfb3Blbj1cIllcIiB1bGNsYXNzPVwiXCIgbmFtZT1cIkN1c3RvbWVyIFJpZ2h0cyBhbmQgSW50ZXJlc3RzXCIgZGVzY3JpcHRpb249XCJcIiBpZD1cIjQ4MzAyYTRlMTVcIiBwYWdlPVwiNDgzMDJhNGUxNVwiIGxpY2xhc3M9XCJcIiBpY29uY2xhc3M9XCJcIiB1cmw9XCJcIj48XC9mdW5jPiAgICAgICA8ZnVuYyBsYXlvdXQ9XCJzdWJjb250ZW50X2VuZ1wiIGlzX29wZW49XCJZXCIgdWxjbGFzcz1cIlwiIG5hbWU9XCJEaWdpdGFsIElubm92YXRpb24gU2VydmljZXNcIiBkZXNjcmlwdGlvbj1cIlwiIGlkPVwiNmM4MTZhZDMxNlwiIHBhZ2U9XCI2YzgxNmFkMzE2XCIgbGljbGFzcz1cIlwiIGljb25jbGFzcz1cIlwiIHVybD1cIlwiPjxcL2Z1bmM+ICAgICAgIDxmdW5jIGxheW91dD1cInN1YmNvbnRlbnRfZW5nXCIgaXNfb3Blbj1cIllcIiB1bGNsYXNzPVwiXCIgbmFtZT1cIkZpbmFuY2lhbCBJbmNsdXNpb25cIiBkZXNjcmlwdGlvbj1cIlwiIGlkPVwiZDY4ZmFkNjcxNVwiIHBhZ2U9XCJkNjhmYWQ2NzE1XCIgbGljbGFzcz1cIlwiIGljb25jbGFzcz1cIlwiIHVybD1cIlwiPjxcL2Z1bmM+ICAgICAgIDxmdW5jIGxheW91dD1cInN1YmNvbnRlbnRfZW5nXCIgaXNfb3Blbj1cIllcIiB1bGNsYXNzPVwiXCIgbmFtZT1cIkVxdWF0b3IgUHJpbmNpcGxlc1wiIGRlc2NyaXB0aW9uPVwiXCIgaWQ9XCI5MzgwOTY0NDE1XCIgcGFnZT1cIjkzODA5NjQ0MTVcIiBsaWNsYXNzPVwiXCIgaWNvbmNsYXNzPVwiXCIgdXJsPVwiXCI+PFwvZnVuYz4gICAgICAgPGZ1bmMgbGF5b3V0PVwic3ViY29udGVudF9lbmdcIiBpc19vcGVuPVwiWVwiIHVsY2xhc3M9XCJcIiBuYW1lPVwiUmVzcG9uc2libGUgSW52ZXN0bWVudFwiIGRlc2NyaXB0aW9uPVwiXCIgaWQ9XCI1NGZmMDhlZTE1XCIgcGFnZT1cIjU0ZmYwOGVlMTVcIiBsaWNsYXNzPVwiXCIgaWNvbmNsYXNzPVwiXCIgdXJsPVwiXCI+PFwvZnVuYz4gICAgICAgPGZ1bmMgbGF5b3V0PVwic3ViY29udGVudF9lbmdcIiBpc19vcGVuPVwiWVwiIHVsY2xhc3M9XCJcIiBuYW1lPVwiUmVzcG9uc2libGUgRmluYW5jaW5nXCIgZGVzY3JpcHRpb249XCJcIiBpZD1cIjZlOGRiMTRhMTVcIiBwYWdlPVwiNmU4ZGIxNGExNVwiIGxpY2xhc3M9XCJcIiBpY29uY2xhc3M9XCJcIiB1cmw9XCJcIj48XC9mdW5jPiAgICAgICA8ZnVuYyBsYXlvdXQ9XCJzdWJjb250ZW50X2VuZ1wiIGlzX29wZW49XCJZXCIgdWxjbGFzcz1cIlwiIG5hbWU9XCJGaW5hbmNpYWwgSW5jbHVzaW9uXCIgZGVzY3JpcHRpb249XCJcIiBpZD1cIjBkYjYyNGE4MTZcIiBwYWdlPVwiMGRiNjI0YTgxNlwiIGxpY2xhc3M9XCJcIiBpY29uY2xhc3M9XCJcIiB1cmw9XCJcIj48XC9mdW5jPiAgICAgICA8ZnVuYyBsYXlvdXQ9XCJzdWJjb250ZW50X2VuZ1wiIGlzX29wZW49XCJZXCIgdWxjbGFzcz1cIlwiIG5hbWU9XCJHcmVlbiBUcmFuc2l0aW9uXCIgZGVzY3JpcHRpb249XCJcIiBpZD1cIjk4NGZiMDEyMTVcIiBwYWdlPVwiOTg0ZmIwMTIxNVwiIGxpY2xhc3M9XCJcIiBpY29uY2xhc3M9XCJcIiB1cmw9XCJcIj48XC9mdW5jPiAgICAgIDxcL2Z1bmM+ICAgICA8XC9mdW5jPiAgICAgPGZ1bmMgbGF5b3V0PVwiXCIgaXNfb3Blbj1cIllcIiB1bGNsYXNzPVwiXCIgbmFtZT1cIkhhcHB5IFdvcmtwbGFjZSBhbmQgU29jaWFsIEluY2x1c2lvblwiIGRlc2NyaXB0aW9uPVwiXCIgaWQ9XCJjYzhmODdmZTE1XCIgcGFnZT1cIlwiIGxpY2xhc3M9XCJcIiBpY29uY2xhc3M9XCJcIiB1cmw9XCJcIj4gICAgICA8ZnVuYyBsYXlvdXQ9XCJzdWJjb250ZW50X2VuZ1wiIGlzX29wZW49XCJZXCIgdWxjbGFzcz1cIlwiIG5hbWU9XCJIdW1hbiBSaWdodHMgUHJvdGVjdGlvblwiIGRlc2NyaXB0aW9uPVwiXCIgaWQ9XCI4MDlmNWEzMTE1XCIgcGFnZT1cIjgwOWY1YTMxMTVcIiBsaWNsYXNzPVwiXCIgaWNvbmNsYXNzPVwiXCIgdXJsPVwiXCI+PFwvZnVuYz4gICAgICA8ZnVuYyBsYXlvdXQ9XCJzdWJjb250ZW50X2VuZ1wiIGlzX29wZW49XCJZXCIgdWxjbGFzcz1cIlwiIG5hbWU9XCJQcm9tb3RpbmcgRGl2ZXJzaXR5IGFuZCBFcXVhbGl0eVwiIGRlc2NyaXB0aW9uPVwiXCIgaWQ9XCI0OGRlMjZhMTE1XCIgcGFnZT1cIjQ4ZGUyNmExMTVcIiBsaWNsYXNzPVwiXCIgaWNvbmNsYXNzPVwiXCIgdXJsPVwiXCI+PFwvZnVuYz4gICAgICA8ZnVuYyBsYXlvdXQ9XCJzdWJjb250ZW50X2VuZ1wiIGlzX29wZW49XCJZXCIgdWxjbGFzcz1cIlwiIG5hbWU9XCJTZXh1YWwgSGFyYXNzbWVudCBQcmV2ZW50aW9uXCIgZGVzY3JpcHRpb249XCJcIiBpZD1cIjRhNzJhZjhiMTVcIiBwYWdlPVwiNGE3MmFmOGIxNVwiIGxpY2xhc3M9XCJcIiBpY29uY2xhc3M9XCJcIiB1cmw9XCJcIj48XC9mdW5jPiAgICAgIDxmdW5jIGxheW91dD1cIlwiIGlzX29wZW49XCJZXCIgdWxjbGFzcz1cIlwiIG5hbWU9XCJUYWxlbnQgQXR0cmFjdGlvbiBhbmQgUmV0ZW50aW9uXCIgZGVzY3JpcHRpb249XCJcIiBpZD1cIjhlNzIwOWVkMTVcIiBwYWdlPVwiXCIgbGljbGFzcz1cIlwiIGljb25jbGFzcz1cIlwiIHVybD1cIlwiPiAgICAgICA8ZnVuYyBsYXlvdXQ9XCJzdWJjb250ZW50X2VuZ1wiIGlzX29wZW49XCJZXCIgdWxjbGFzcz1cIlwiIG5hbWU9XCJFbXBsb3llZSBDb21wb3NpdGlvbiBhbmQgRGl2ZXJzaXR5XCIgZGVzY3JpcHRpb249XCJcIiBpZD1cImNhMjY0MWYzMTVcIiBwYWdlPVwiY2EyNjQxZjMxNVwiIGxpY2xhc3M9XCJcIiBpY29uY2xhc3M9XCJcIiB1cmw9XCJcIj48XC9mdW5jPiAgICAgICA8ZnVuYyBsYXlvdXQ9XCJzdWJjb250ZW50XCIgaXNfb3Blbj1cIllcIiB1bGNsYXNzPVwiXCIgbmFtZT1cIkVtcGxveWVlIENvbXBlbnNhdGlvbiBhbmQgQmVuZWZpdHNcIiBkZXNjcmlwdGlvbj1cIlwiIGlkPVwiZDE2ZWUwZDcxNVwiIHBhZ2U9XCJkMTZlZTBkNzE1XCIgbGljbGFzcz1cIlwiIGljb25jbGFzcz1cIlwiIHVybD1cIlwiPjxcL2Z1bmM+ICAgICAgIDxmdW5jIGxheW91dD1cInN1YmNvbnRlbnRfZW5nXCIgaXNfb3Blbj1cIllcIiB1bGNsYXNzPVwiXCIgbmFtZT1cIkVtcGxveWVlIENvbW11bmljYXRpb24gQ2hhbm5lbFwiIGRlc2NyaXB0aW9uPVwiXCIgaWQ9XCI2MDViZmVkZjE1XCIgcGFnZT1cIjYwNWJmZWRmMTVcIiBsaWNsYXNzPVwiXCIgaWNvbmNsYXNzPVwiXCIgdXJsPVwiXCI+PFwvZnVuYz4gICAgICA8XC9mdW5jPiAgICAgIDxmdW5jIGxheW91dD1cInN1YmNvbnRlbnRfZW5nXCIgaXNfb3Blbj1cIllcIiB1bGNsYXNzPVwiXCIgbmFtZT1cIkVtcGxveWVlIEN1bHRpdmF0aW9uIGFuZCBEZXZlbG9wbWVudFwiIGRlc2NyaXB0aW9uPVwiXCIgaWQ9XCI0ZTQwMmZiZTE1XCIgcGFnZT1cIjRlNDAyZmJlMTVcIiBsaWNsYXNzPVwiXCIgaWNvbmNsYXNzPVwiXCIgdXJsPVwiXCI+PFwvZnVuYz4gICAgICA8ZnVuYyBsYXlvdXQ9XCJzdWJjb250ZW50X2VuZ1wiIGlzX29wZW49XCJZXCIgdWxjbGFzcz1cIlwiIG5hbWU9XCJPY2N1cGF0aW9uYWwgU2FmZXR5IGFuZCBIZWFsdGhcIiBkZXNjcmlwdGlvbj1cIlwiIGlkPVwiOTFhYTFjNDExNVwiIHBhZ2U9XCI5MWFhMWM0MTE1XCIgbGljbGFzcz1cIlwiIGljb25jbGFzcz1cIlwiIHVybD1cIlwiPjxcL2Z1bmM+ICAgICAgPGZ1bmMgbGF5b3V0PVwic3ViY29udGVudF9lbmdcIiBpc19vcGVuPVwiWVwiIHVsY2xhc3M9XCJcIiBuYW1lPVwiQ2hhcml0YWJsZSBTdHJhdGVneSBhbmQgSW5mbHVlbmNlXCIgZGVzY3JpcHRpb249XCJcIiBpZD1cImM2MzRhOTMyMTVcIiBwYWdlPVwiYzYzNGE5MzIxNVwiIGxpY2xhc3M9XCJcIiBpY29uY2xhc3M9XCJcIiB1cmw9XCJcIj48XC9mdW5jPiAgICAgIDxmdW5jIGxheW91dD1cInN1YmNvbnRlbnRfZW5nXCIgaXNfb3Blbj1cIllcIiB1bGNsYXNzPVwiXCIgbmFtZT1cIkZpbmFuY2lhbCBMaXRlcmFjeSBFZHVjYXRpb25cIiBkZXNjcmlwdGlvbj1cIlwiIGlkPVwiZDMzMWFjYjUxNVwiIHBhZ2U9XCJkMzMxYWNiNTE1XCIgbGljbGFzcz1cIlwiIGljb25jbGFzcz1cIlwiIHVybD1cIlwiPjxcL2Z1bmM+ICAgICA8XC9mdW5jPiAgICAgPGZ1bmMgbGF5b3V0PVwiXCIgaXNfb3Blbj1cIllcIiB1bGNsYXNzPVwiXCIgbmFtZT1cIkF3YXJkcyBhbmQgUmVjb2duaXRpb25cIiBkZXNjcmlwdGlvbj1cIlwiIGlkPVwiYTY3ZjM0NGMxNVwiIHBhZ2U9XCJcIiBsaWNsYXNzPVwiXCIgaWNvbmNsYXNzPVwiXCIgdXJsPVwiXCI+ICAgICAgPGZ1bmMgbGF5b3V0PVwic3ViY29udGVudF9lbmdcIiBpc19vcGVuPVwiWVwiIHVsY2xhc3M9XCJcIiBuYW1lPVwiSG9ub3JzLCBSZWNvZ25pdGlvbnMgYW5kIFN1c3RhaW5hYmxlIFBlcmZvcm1hbmNlc1wiIGRlc2NyaXB0aW9uPVwiXCIgaWQ9XCIxM2FlMTc5NjE1XCIgcGFnZT1cIjEzYWUxNzk2MTVcIiBsaWNsYXNzPVwiXCIgaWNvbmNsYXNzPVwiXCIgdXJsPVwiXCI+PFwvZnVuYz4gICAgICA8ZnVuYyBsYXlvdXQ9XCJzdWJjb250ZW50X2VuZ1wiIGlzX29wZW49XCJZXCIgdWxjbGFzcz1cIlwiIG5hbWU9XCJJbnRlcm5hdGlvbmFsIENlcnRpZmljYXRpb25zXCIgZGVzY3JpcHRpb249XCJcIiBpZD1cIjYxNmMxZTYxMTVcIiBwYWdlPVwiNjE2YzFlNjExNVwiIGxpY2xhc3M9XCJcIiBpY29uY2xhc3M9XCJcIiB1cmw9XCJcIj48XC9mdW5jPiAgICAgPFwvZnVuYz4gICAgIDxmdW5jIGxheW91dD1cIlwiIGlzX29wZW49XCJZXCIgdWxjbGFzcz1cIlwiIG5hbWU9XCJGcmllbmRseSBMaW5rc1wiIGRlc2NyaXB0aW9uPVwiXCIgaWQ9XCIzOGZkOWQ3YzE1XCIgcGFnZT1cIlwiIGxpY2xhc3M9XCJcIiBpY29uY2xhc3M9XCJcIiB1cmw9XCJcIj4gICAgICA8ZnVuYyBsYXlvdXQ9XCJzdWJjb250ZW50X2VuZ1wiIGlzX29wZW49XCJZXCIgdWxjbGFzcz1cIlwiIG5hbWU9XCJGcmllbmRseSBMaW5rc1wiIGRlc2NyaXB0aW9uPVwiXCIgaWQ9XCIyY2IwNDc2NTE1XCIgcGFnZT1cIjJjYjA0NzY1MTVcIiBsaWNsYXNzPVwiXCIgaWNvbmNsYXNzPVwiXCIgdXJsPVwiXCI+PFwvZnVuYz4gICAgIDxcL2Z1bmM+ICAgIDxcL2Z1bmM+ICAgIDxmdW5jIGxheW91dD1cIlwiIGlzX29wZW49XCJZXCIgdWxjbGFzcz1cIlwiIG5hbWU9XCJTdWIgbWVudVwiIGRlc2NyaXB0aW9uPVwiU3ViIG1lbnVcIiBpZD1cInRvcG1lbnUxX2VuZ1wiIHBhZ2U9XCJcIiBsaWNsYXNzPVwiXCIgaWNvbmNsYXNzPVwiXCIgdXJsPVwiXCI+ICAgICA8ZnVuYyBsYXlvdXQ9XCJcIiBpc19vcGVuPVwiWVwiIHVsY2xhc3M9XCJcIiBuYW1lPVwiQ0hJTkVTRVwiIGRlc2NyaXB0aW9uPVwiXCIgaWQ9XCJhMWE0MTQyMzE1XCIgcGFnZT1cIlwiIGxpY2xhc3M9XCJcIiBpY29uY2xhc3M9XCJcIiB1cmw9XCJpbmRleC5qc3BcIj48XC9mdW5jPiAgICAgPGZ1bmMgbGF5b3V0PVwiXCIgaXNfb3Blbj1cIllcIiB1bGNsYXNzPVwiXCIgbmFtZT1cIlNpdGVtYXBcIiBkZXNjcmlwdGlvbj1cIlwiIGlkPVwic2l0ZW1hcF9lbmdcIiBwYWdlPVwiXCIgbGljbGFzcz1cIlwiIGljb25jbGFzcz1cIlwiIHVybD1cInNpdGVtYXBfZW5nLmpzcFwiPjxcL2Z1bmM+ICAgIDxcL2Z1bmM+ICAgIDxmdW5jIGxheW91dD1cIlwiIGlzX29wZW49XCJZXCIgdWxjbGFzcz1cIlwiIG5hbWU9XCJcdTUxNzZcdTRFRDZcIiBkZXNjcmlwdGlvbj1cIlwiIGlkPVwib3RoZXJcIiBwYWdlPVwiXCIgbGljbGFzcz1cIlwiIGljb25jbGFzcz1cIlwiIHVybD1cIlwiPiAgICAgPGZ1bmMgbGF5b3V0PVwic3ViY29udGVudFwiIGlzX29wZW49XCJZXCIgdWxjbGFzcz1cIlwiIG5hbWU9XCJcdTRFMEJcdThGMDlcdTZDMzhcdTdFOENcL1x1NEYwMVx1Njk2RFx1NzkzRVx1NjcwM1x1OENBQ1x1NEVGQlx1NTgzMVx1NTQ0QVx1NjZGOFwiIGRlc2NyaXB0aW9uPVwiXCIgaWQ9XCI2NmM0YzUxMTE1XCIgcGFnZT1cIjY2YzRjNTExMTVcIiBsaWNsYXNzPVwiXCIgaWNvbmNsYXNzPVwiXCIgdXJsPVwiXCI+PFwvZnVuYz4gICAgPFwvZnVuYz4gICAgPGZ1bmMgbGF5b3V0PVwiXCIgaXNfb3Blbj1cIllcIiB1bGNsYXNzPVwiXCIgbmFtZT1cIk90aGVyXCIgZGVzY3JpcHRpb249XCJcIiBpZD1cIm90aGVyX2VuXCIgcGFnZT1cIlwiIGxpY2xhc3M9XCJcIiBpY29uY2xhc3M9XCJcIiB1cmw9XCJcIj4gICAgIDxmdW5jIGxheW91dD1cInN1YmNvbnRlbnRfZW5nXCIgaXNfb3Blbj1cIllcIiB1bGNsYXNzPVwiXCIgbmFtZT1cIkRvd25sb2FkIEVTRyBSZXBvcnRzXCIgZGVzY3JpcHRpb249XCJcIiBpZD1cIjZkYjg3MjUyMTVcIiBwYWdlPVwiNmRiODcyNTIxNVwiIGxpY2xhc3M9XCJcIiBpY29uY2xhc3M9XCJcIiB1cmw9XCJcIj48XC9mdW5jPiAgICA8XC9mdW5jPiAgIDxcL2Z1bmNzPiAgPFwvZ2FyZGVuPiA8XC9ib2R5PjxcL2h0bWw+
Jump to main content



For the best experience, change the screen to portrait mode.
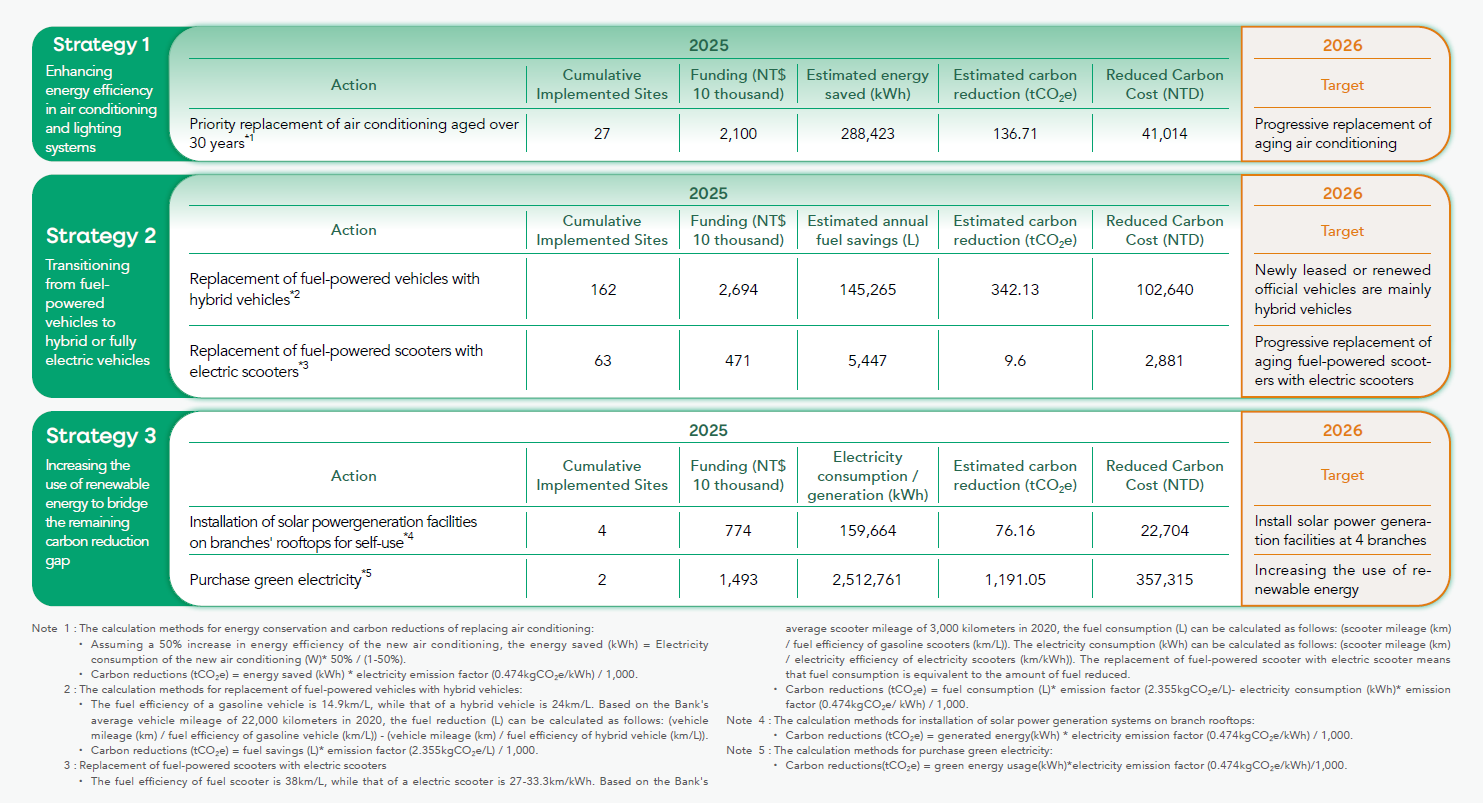
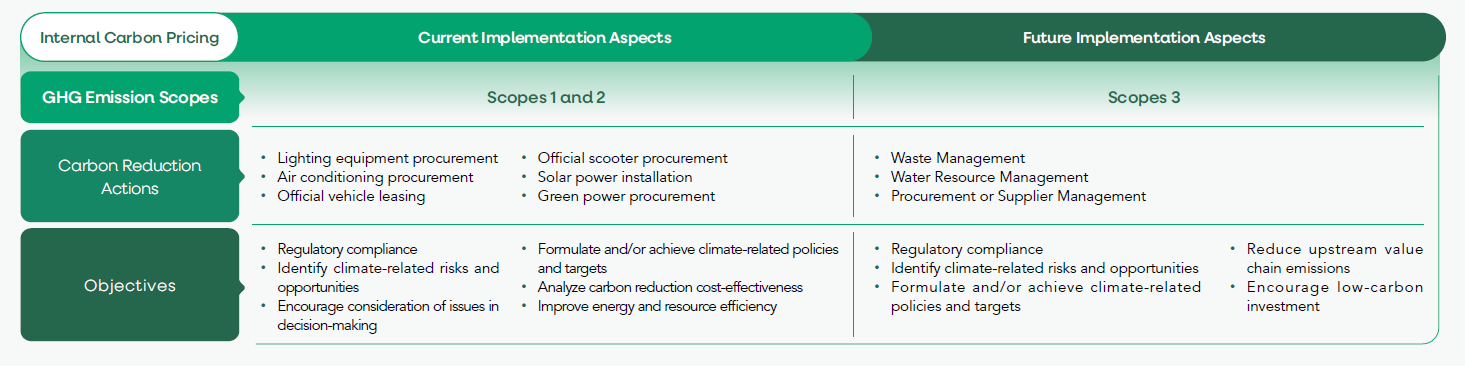
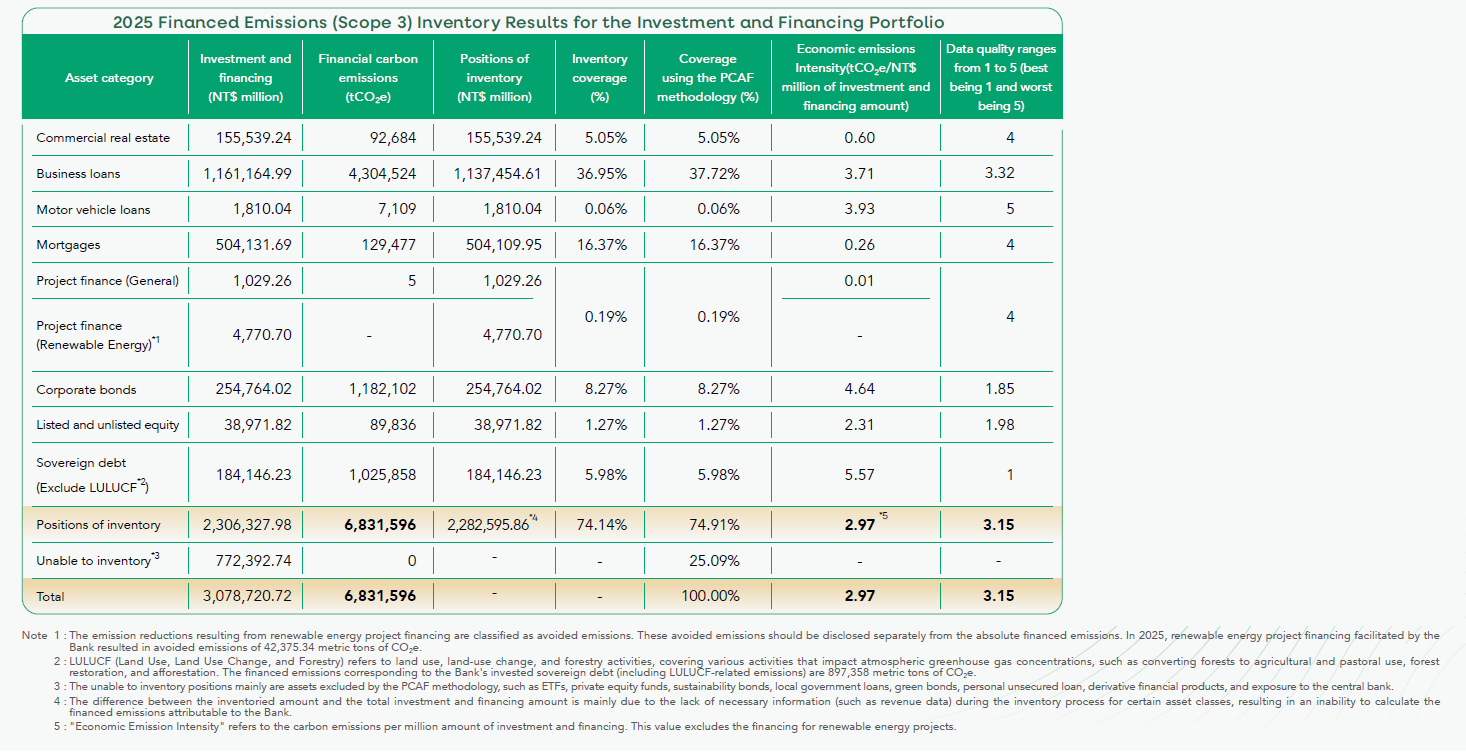
The Bank adopts the operational control approach to inventory greenhouse gas (GHG) emissions across all domestic, overseas, and subsidiary operational sites, ensuring that the scope of GHG emissions disclosure aligns with the scope of the consolidated financial statements. Independent third-party agencies are engaged to conduct verification, and the status of GHG management is regularly reported to the Sustainable Development Committee and the Board of Directors to facilitate effective tracking and oversight of emission reduction measures.
|
The Bank's GHG Inventory Scopes
|
|
|
Entity
|
|
|
The Bank (domestic and overseas operational sites)
|
|
|
Subsidiaries
|
CHB Venture Capital
|
|
Chang Hua Commercial Bank
|
|
|
GHG Inventory
|
|
|
Category
|
Coverage
|
|
1~5
|
100%
|
|
Category
|
2025(tCO2e)
|
|
Category 1: Direct GHG emissions(Note 1)
|
1,967.941
|
|
Category 2: Indirect GHG emissions from imported energy(Note 2)
|
10,964.198
|
|
Total emissions (Category 1 + Category 2)
|
12,932.139
|
|
Category 3: Indirect GHG emissions from transportation(Note 3)
|
3,281.142
|
|
Category 4: Indirect GHG emissions from products and services used by the organization(Note 4)
|
11,761.038
|
|
Category 5: Indirect GHG emissions from the use of products from the organization(Note 5)
|
3,282.315
|
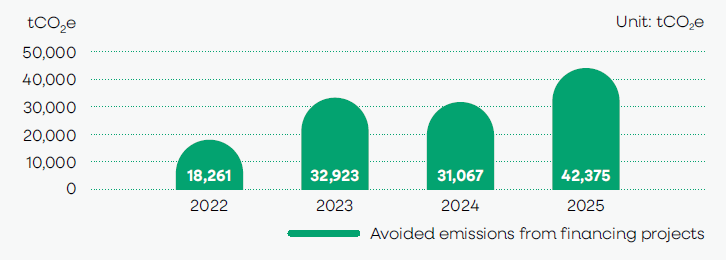
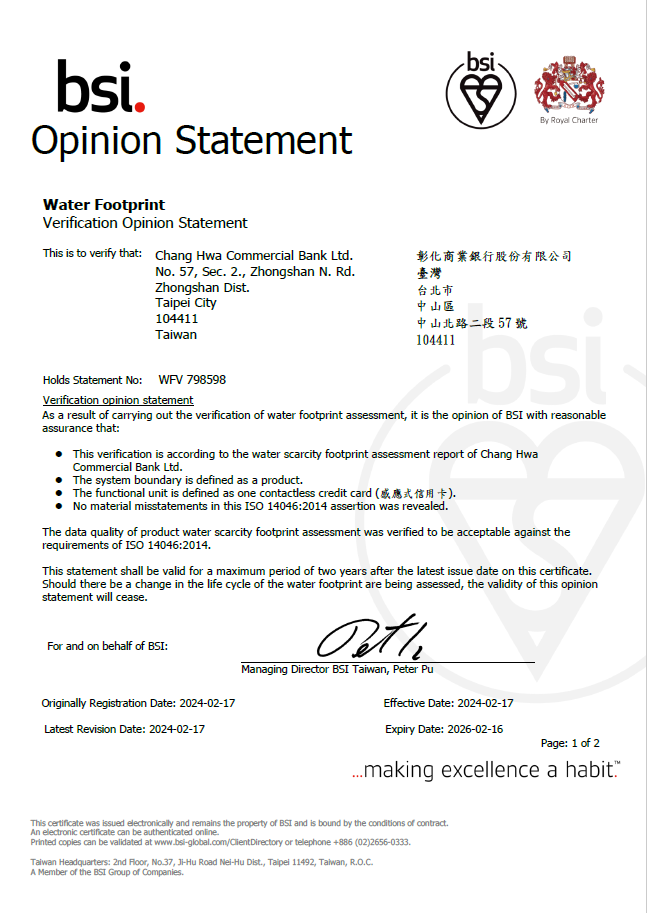
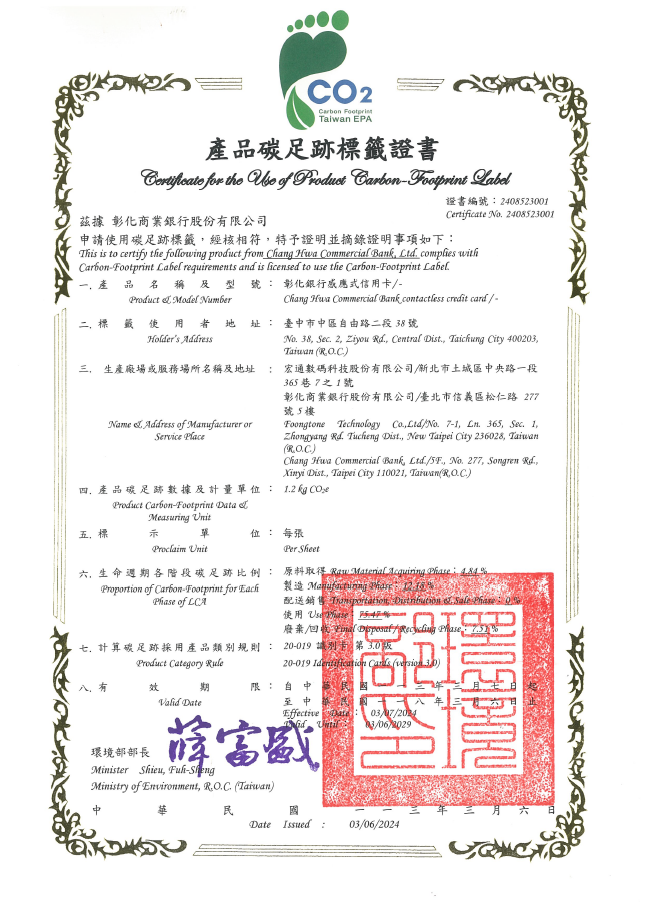
To understand the carbon footprint of the Bank's products and services and further reduce GHG emissions, the Bank applied the ISO 14067 carbon footprint standard and the ISO 14046 water footprint standard for its contactless credit cards in 2024. The Bank also obtained a verification statement from the British Standards Institution (BSI) and a product carbon footprint label certificate from the Ministry of Environment. To communicate the Bank's net-zero commitment and carbon management performance to customers, the Bank also conducted ISO 14067 carbon footprint inventories and verifications for three online financial services: online loan services, digital deposit account opening, and TWD/foreign currency deposit overview inquiry. It is expected to obtain carbon footprint label certificates from the Ministry of Environment in 2026 and 2027, respectively.
|
ISO 14067 Carbon Footprint Verification
|
ISO 14046 Water Footprint Verification
|
CFP (Carbon Footprint of Product) Label
|

|
|
|
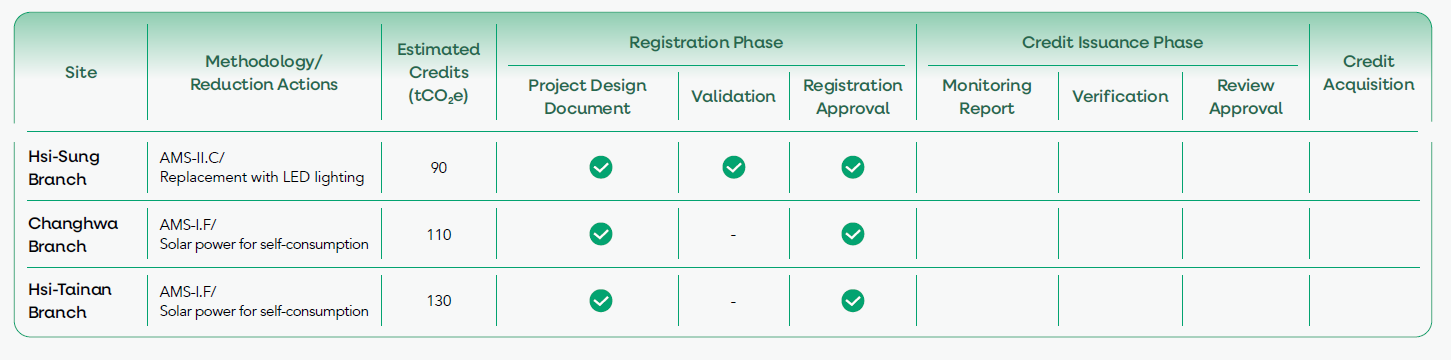
In response of the 2050 net-zero transition, the Bank has proactively launched the "Carbon Neutral Demonstration Branch Plan." Branches with outstanding annual emission reduction performance were selected to implement the carbon neutrality demonstration in accordance with "PAS 2060: 2014 Specification for the Demonstration of Carbon Neutrality". Since 2022, the Bank has successfully completed carbon neutrality initiatives at the Changhwa Branch, Shulin Branch, Min-Sheng Branch, and Hsi-Tainan Branch.